Page History
| Div | ||||||
|---|---|---|---|---|---|---|
| ||||||
|
After having queried the data of a process as described in Querying Process Data, you can select between four predefined process charts:
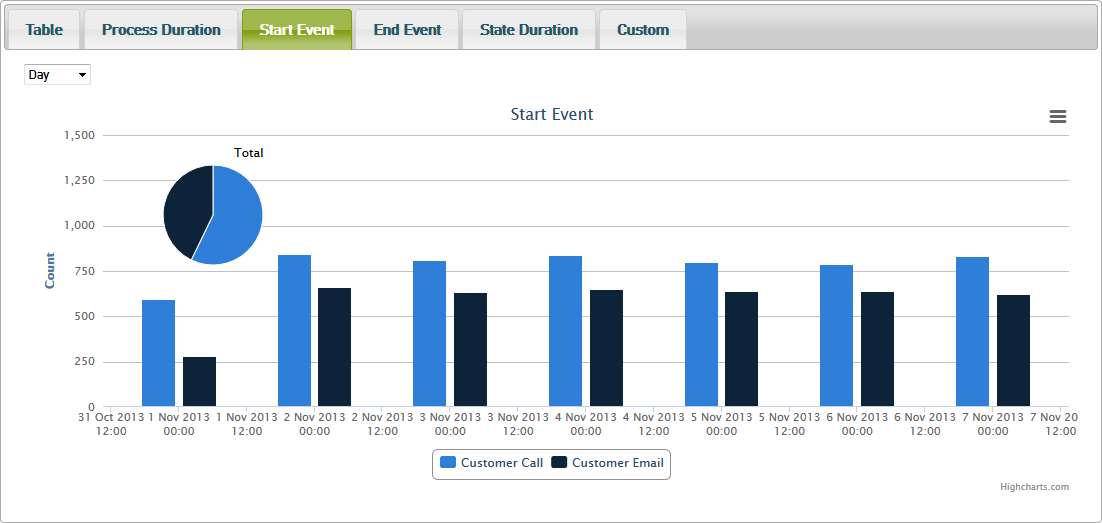
Figure: The Start Event Chart
All charts may be printed or exported to different formats (PNG, JPEG, PDF and SVG). Use the context menu button of the chart for that.
| Multiexcerpt | ||||||
|---|---|---|---|---|---|---|
| ||||||
|
The Process Duration Chart
The Process Duration chart shows the minimum, average and maximum of the overall process duration in a curve diagram.
Figure: The Process Duration Chart
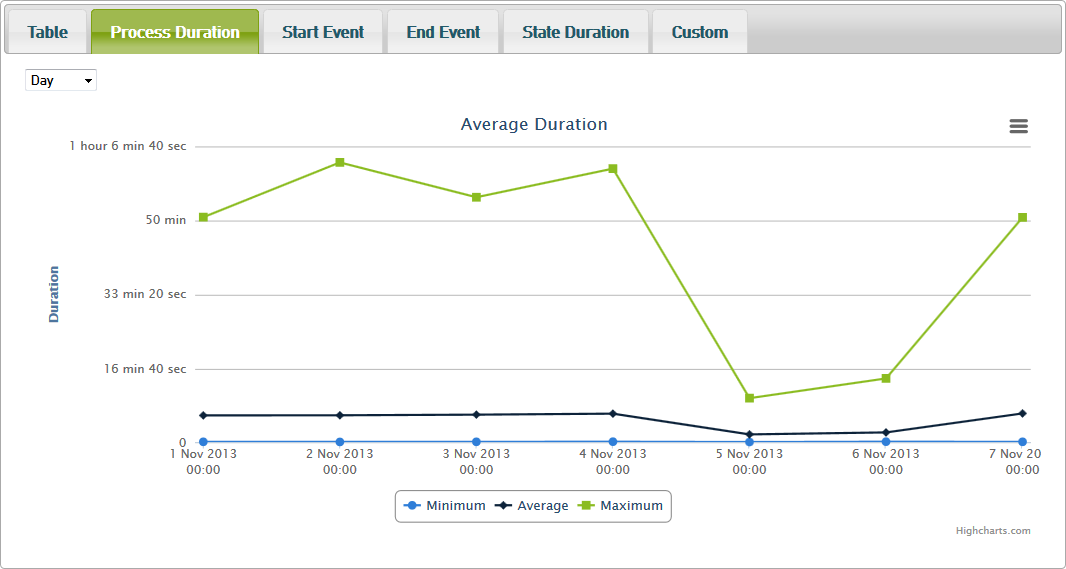
With help of the Process Duration chart you can detect problems concerning the process in relation to the time, e.g. day of the week or hour of the day.
The Start/End Event Chart
The Start Event and the End Event charts show all different start/end events of the process per time unit in a bar diagram. A pie chart gives you the overview of the distribution of start/end events within the total of all start/end events.
Figure: The Start Event Chart
With help of the Start or End Event chart you can analyze process start or end events.
The State Duration Chart
The State Duration chart shows the average of time the process instances dwell in each state as a stacked bar chart.
Figure: State Duration Chart
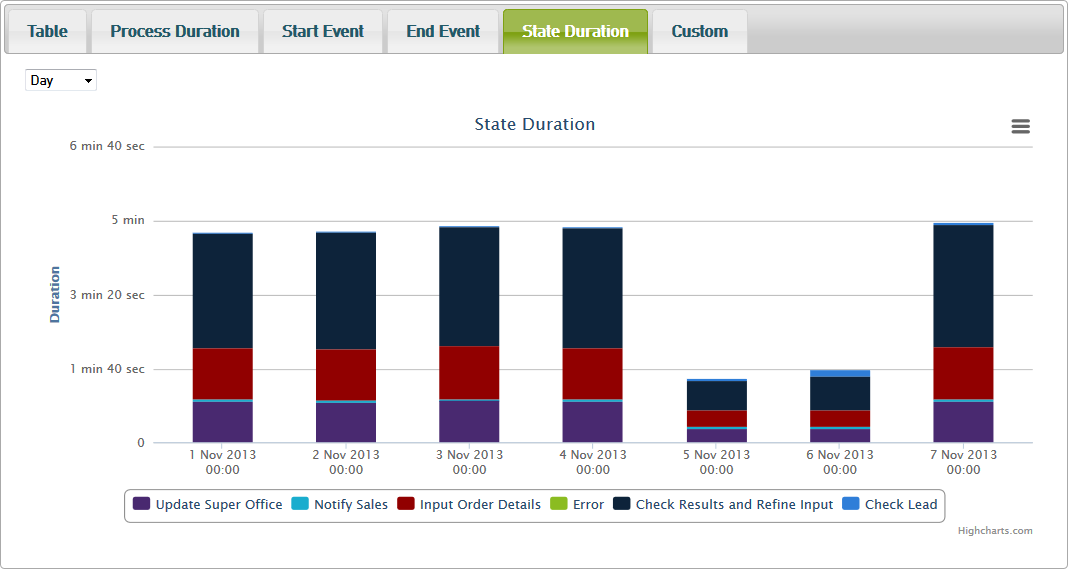
With the help of the State Duration chart you can analyze e.g. which state causes the longest delay within the process.
| Panel | ||
|---|---|---|
| ||
|
| Panel | ||
|---|---|---|
| ||
Overview
Content Tools