Page History
| Div | |||
|---|---|---|---|
| |||
|
...
...
To make first steps with the Analyzer, follow the instructions below.
...
...
Click menu item Project > Open Builder Project .
For more information on Builder projects in general refer to the Builder User Guide.
If you have chosen the default settings while unpacking the examples, you will find a Builder project Education Solution in C:\E2E Documentation. For more information on how to unpack the examples, refer to Unzipping Examples.
...
Builder projects are directories marked with an icon. In this folder, you can also find further examples.
To open the Education Solution project, select it and click OK.
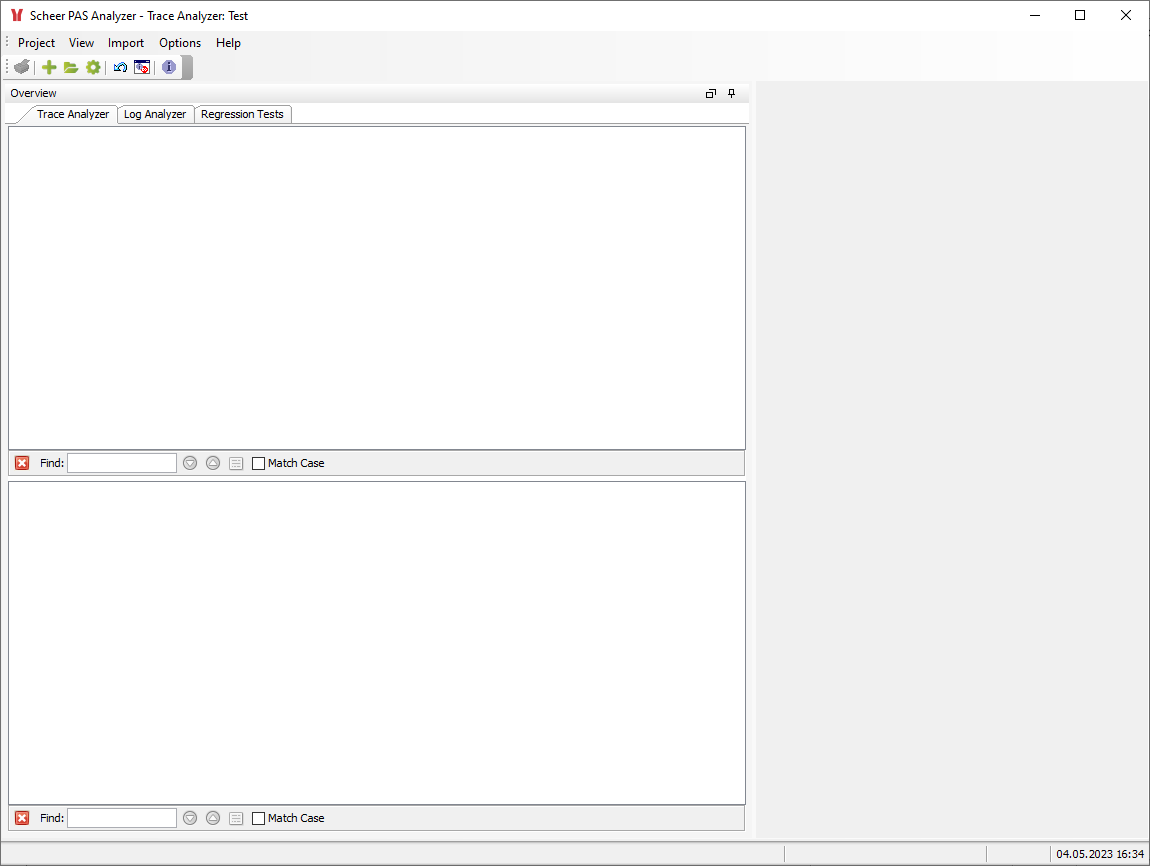
The Analyzer Window
The Analyzer window is divided into different parts:
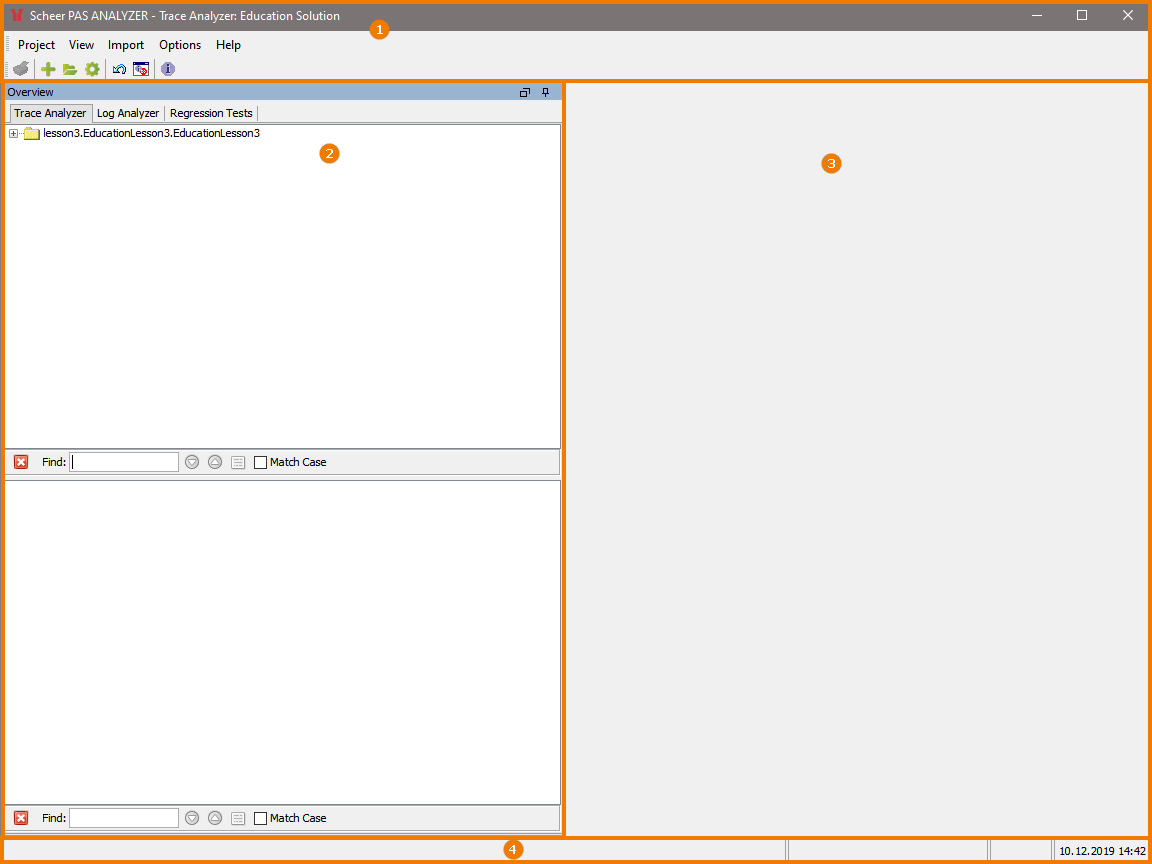
- The header comprising the main menu and the main toolbar.
- The Overview window containing the Trace Analyzer, Log Analyzer and Regression Test Tool.
- The content pane showing contents depending on the selection made in the overview window.
- The status bar at the bottom of the window.
Header
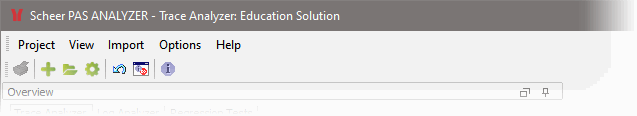
The header shows
- the product name ( Scheer PAS Analyzer ), followed by
- the selected tool ( Trace Analyzer ) and
- the opened project ( Education Solution ) if any.
Refer to the Overview on the Analyzer Menus for more information on the main menu and the main toolbar.
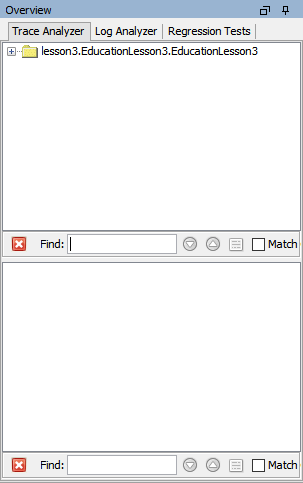
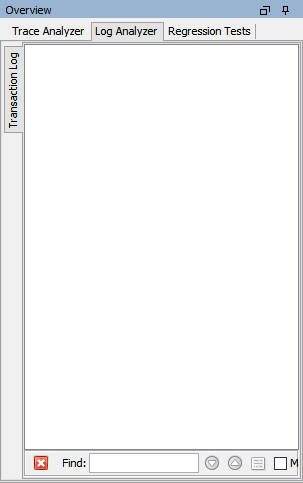
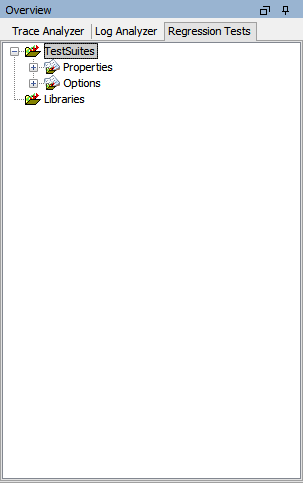
Overview Window
The overview window contains three tabs:
| Section | |||||||||||||||
|---|---|---|---|---|---|---|---|---|---|---|---|---|---|---|---|
|
Content Pane
The content pane shows contents depending on the selected tool in the overview window.
Status Bar
The status bar shows messages and errors regarding the activity of the user.
...
| icon | false |
|---|
...
Overview
Content Tools