After the Analyzer has been installed (see Analyzer Installation Guide for more), you can open it by using the shortcut on the desktop or from the Start menu (Windows) or by running the start script (Linux). |
The Analyzer window opens as shown in the picture below.
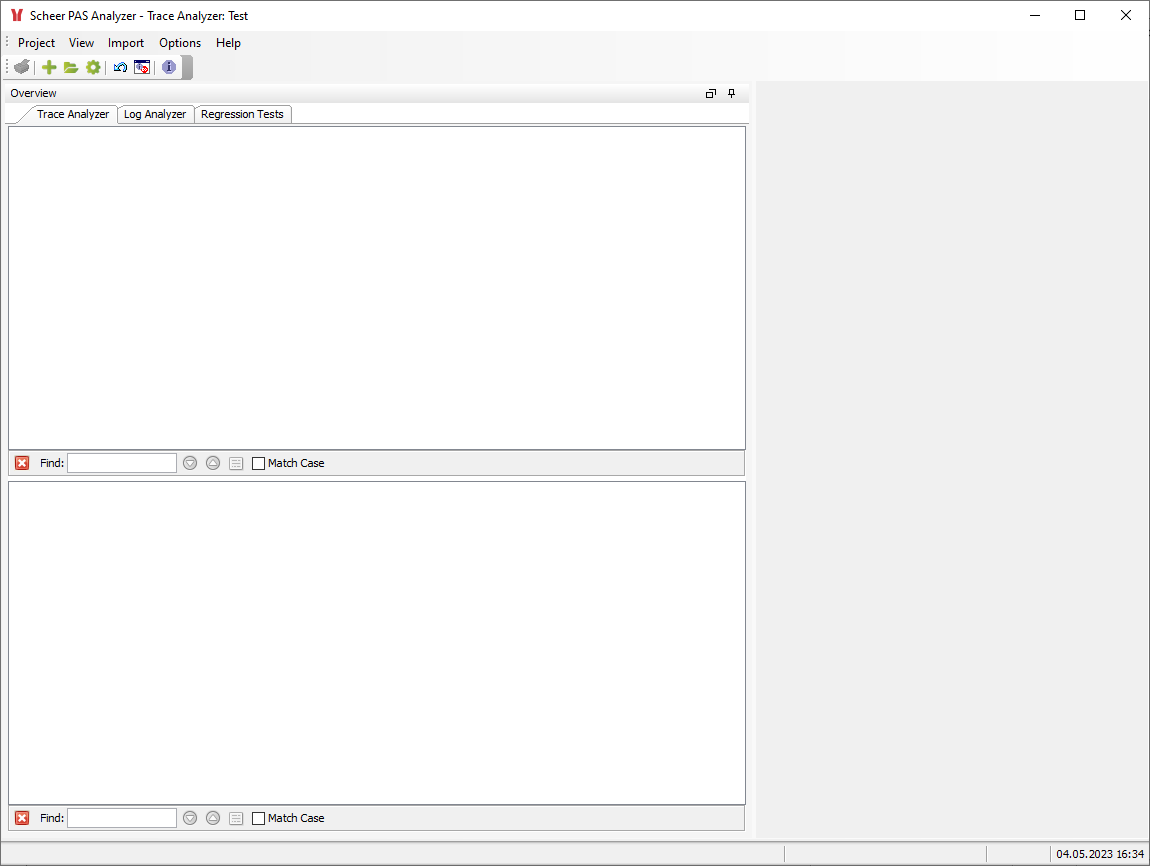
The Analyzer Window
The Analyzer window is divided into different parts:
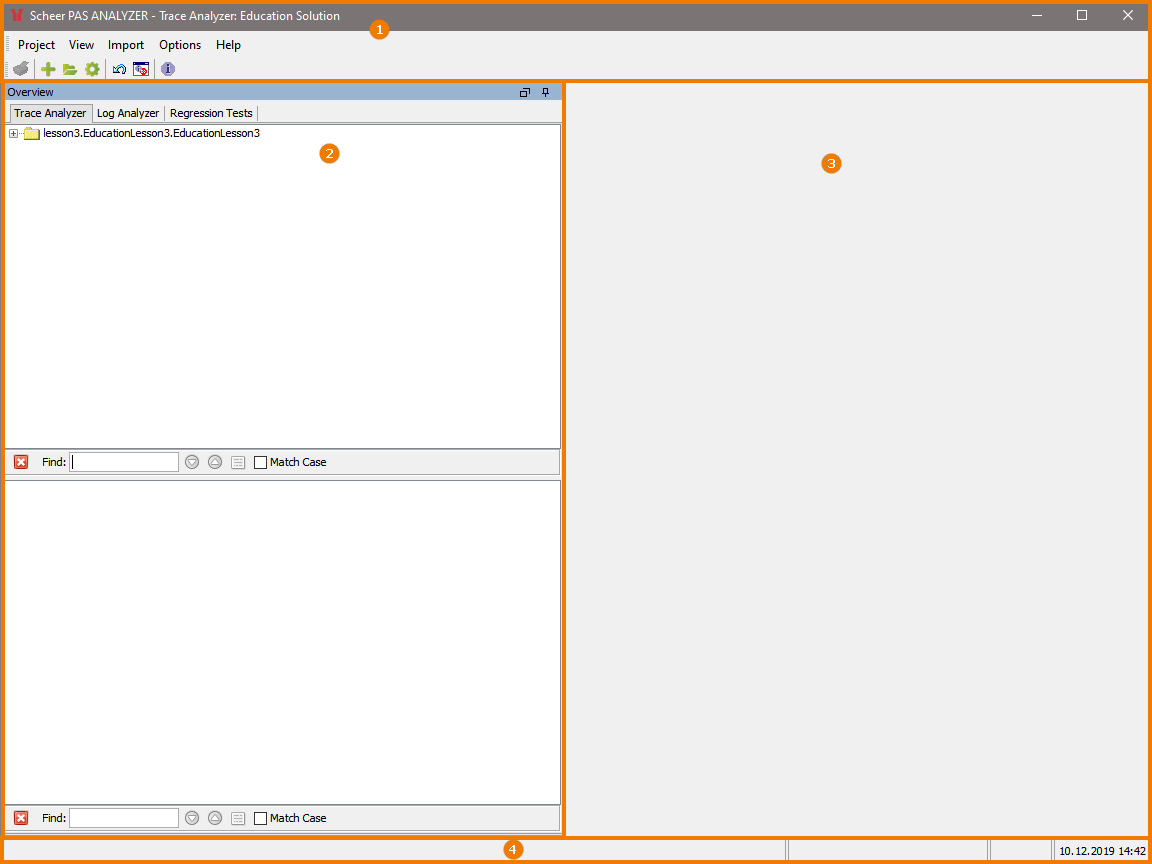
- The header comprising the main menu and the main toolbar.
- The Overview window containing the Trace Analyzer, Log Analyzer and Regression Test Tool.
- The content pane showing contents depending on the selection made in the overview window.
- The status bar at the bottom of the window.
Header
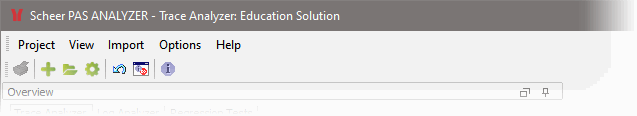
The header shows
- the product name ( Scheer PAS Analyzer ), followed by
- the selected tool ( Trace Analyzer ) and
- the opened project ( Education Solution ) if any.
Refer to the Overview on the Analyzer Menus for more information on the main menu and the main toolbar.
Overview Window
The overview window contains three tabs:
Trace Analyzer
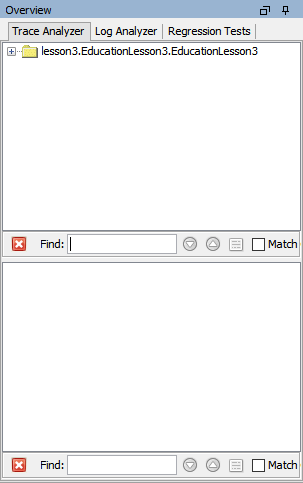
The Trace Analyzer tab is divided into two parts, the upper for synchronous and the lower for asynchronous testing.
For more information on the usage of the xUML Trace Analyzer refer to Using the xUML Trace Analyzer.
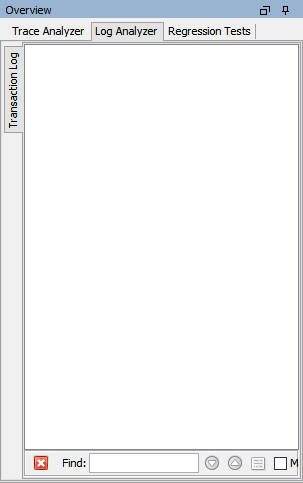
Log Analyzer
Regression Test Tool
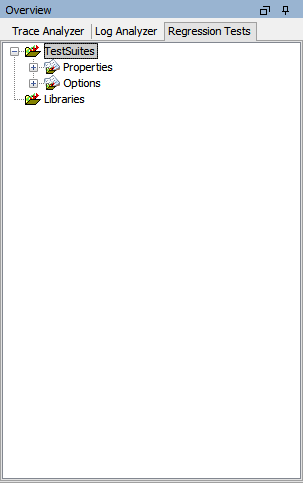
For more information on the usage of the Regression Test Tool refer to Performing Regression Tests.
Content Pane
The content pane shows contents depending on the selected tool in the overview window.
Status Bar
The status bar shows messages and errors regarding the activity of the user.
On this Page:
Related Documentation:
Overview
Content Tools