Page History
...
Switch to the Logging tab in the information/working area.
All users have access to logged information that is categorized as follows:
| Log | Technical Name | Description | ||||||
|---|---|---|---|---|---|---|---|---|
| Installation Log | npm-install | Contains errors and warnings that have been written during npm install. | ||||||
| Start Log | start | Contains information about the selected Node.js service, environment variables, and errors logged by the Bridge process at startup. | ||||||
| Error Log | stderr | Contains errors that have been written by the Node.js service to stderr. | ||||||
| Service Log | stdout | Contains messages that have been written by the Node.js service to stdout. | ||||||
| Custom Logs | <your name> |
|
Filtering the Log Entries
...
| MultiExcerptName | filtering_log_entries |
|---|
Logs may contain big amounts of data and in these cases it may be difficult to find the peace of information you are looking for. Therefore, you can filter the logfile entries by a regular expression, and - depending on the log type - by log level and date/time.
| Filter Element | Description | Default |
|---|---|---|
| Search for |
Insert a string or a valid regular expression to search the log entries for. Only log entries that match the expression will be displayed.
Refer to Java Regular Expressions for more information on which regular expressions you can use here.
...
| empty | ||||||
| type | Select the type of logfile you want to display: npm-install, start, stderr, stdout, custom log types. See top of this page for more information on the log types. The log types are displayed in this list in alphabetical order and the first log type of this list will be the default. So, if you added a custom log named aa.log, this log will be displayed on going to the Logging page. | first available log type | |||||
| log level | This filter is not available for Node.js services. | ||||||
| from |
...
Select the date/time range you want to inspect.
- From is set to now - 10 minutes upon opening the logging tab. You can remove the time part of the from field to display all log entries of the given day.
- You can enter the date/time manually or by using the date/time picker next to the field.
- An empty to field displays all log entries from the from date/time until the most recent entries.
An empty from field triggers a search backwards until the first entries are found. - You can remove the time part of the to field to search until the end of the day, and of the from field to search from the beginning of the day.
Pressing Enter in these fields triggers the search. To enter the dates, you can use a date picker next to the input fields:
|
...
| actual timestamp - 10 min | |
| to | empty |
Click View to update the displayed logging information.
As per default, for logs with a time stamp the log entries are displayed latest first in the search results. Click the tiny arrow in the table header to change the order to oldest first.
The date filter settings will be kept as long as your Browser tab is open. They will be reset to default as soon as you open the Logging tab in a new Browser tab.
...
| icon | false |
|---|
...
| Multiexcerpt include | ||||
|---|---|---|---|---|
|
The Date Picker
| Multiexcerpt include | ||||
|---|---|---|---|---|
|
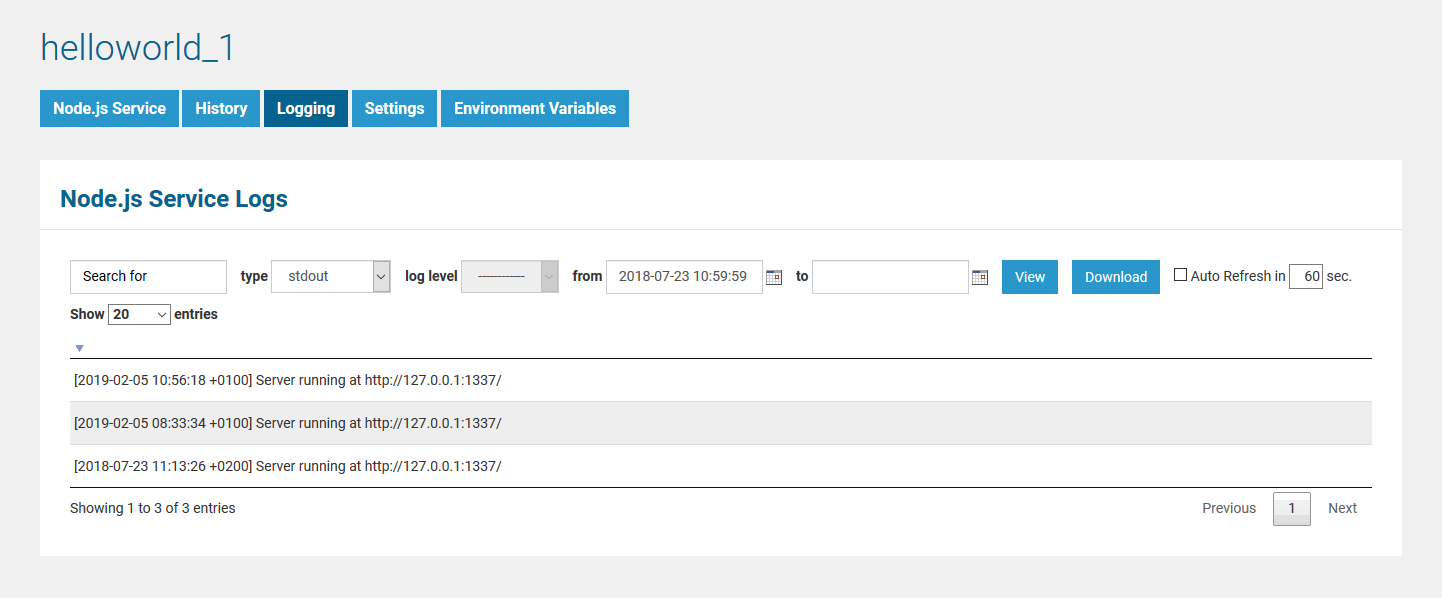
The Search Results
The results according to your search conditions are displayed in a paged list:
- You can define how many results should be displayed on one page by selecting on of 20, 50, 100, 250 and 1000 from the Show entries dropdown.
- At the bottom of the log table, you can see how many log entries have been found and how many of them are displayed: Showing 1 to 20 of 78 entries.
- You can auto refresh the search results by checking the Auto Refresh checkbox. Specify an interval in seconds, or leave the default (60 seconds).
- Multi-line log messages are collapsed to not clutter the list of results. You can expand those multipart lines by clicking the plus sign at the end of the visible message part.
- Use the buttons Previous and Next to browse through the results, or select a result page by clicking on a page number.
- By clicking Download, you can download the search result (all pages) as a simple flat file that resides in a ZIP archive.
Installation Log
The npm-install log contains the output of the npm install command.
Select npm-install from the Type drop-down list to view the installation log. You cannot select a date range, as the npm-install log will be overwritten each time the command is executed.
...
Figure: The Node.js Service Log
Log Encoding
| Info | ||
|---|---|---|
| ||
If you are writing messages to log files that will be displayed on the Bridge (npm-install, start, stdout, stderr, custom logfiles), you must use UTF-8 encoding. If you do not, special characters may be displayed wrongly in the log view. |
Overview
Content Tools