The main screen of the UI shows a Service Error List, a list of all errors that have previously occurred on the Bridge node where the Monitoring service is running.
Figure: Main Screen of the Monitoring UI
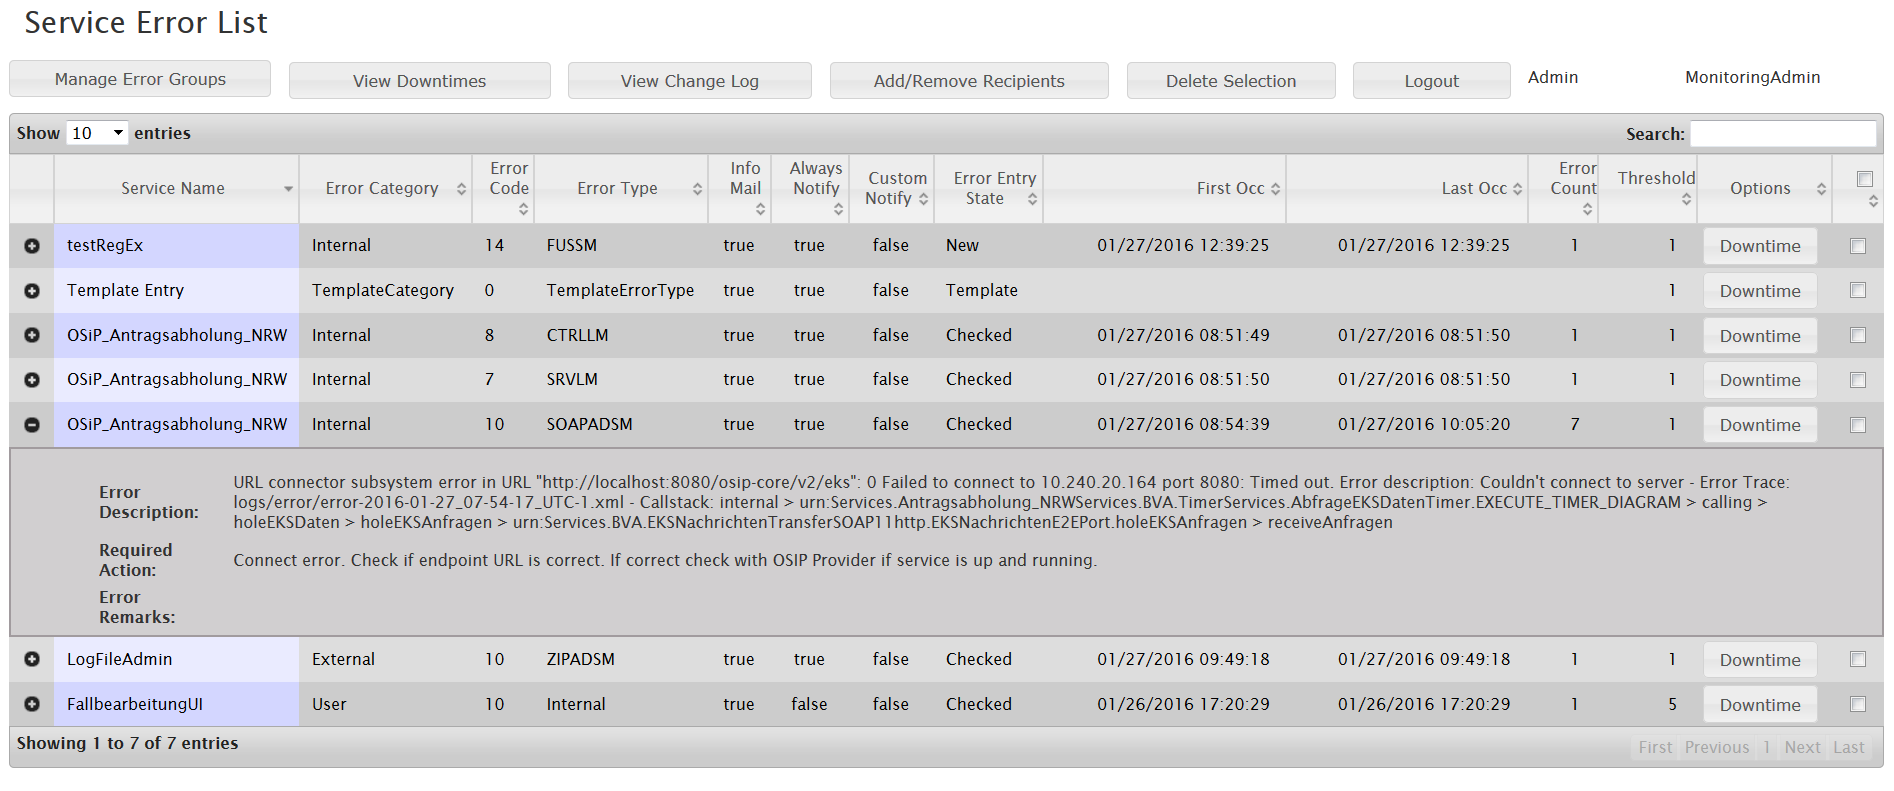
Once an error occurs during the execution of a Bridge service, an error type entry is written to that service's log file. These will be collected by the Monitoring Base Service. The Monitoring UI presents a user interface to configure the individual handling of known errors. In order to configure a specific error, it has to occur at least once. So this list typically grows over time.
When an error occurs for the first time, a new entry in the error list is created, using the default settings from the template entry (see screenshot above, the first entry in the list is that template entry). You can tweak this template entry to your needs, so new entries will get the most appropriate settings.
Once the entry is created, it can be modified to configure individual handling for this specific type of error. To open the configuration dialog, double click the entry in the list.
The first four columns of the table are generated by the Bridge and contain the meta info about the error: which service raised this error, and category, code and type of the error. This can either be one of the uncaught errors thrown by the xUML Runtime (see also Error Codes) or a user generated log entry by using the log operation and type Error (only type Error is notified by the Bridge, refer to Logging for explicit error logging).
| Table Column | Description | Values | |
|---|---|---|---|
| Info Mail | If checked, an email is sent to the recipients configured below. | true, false | |
| Always Notify | If checked, the notification is triggered each time the error threshold is reached. If unchecked, the notification is triggered once per day only. | true, false | |
| Custom Notify | If checked, a custom notification is triggered. This is a customized extension of the Monitoring Base Service, allowing the integration with other monitoring or ticketing systems like Nagios, JIRA, DataDog etc. This can be configured by linking a customer specific library. Please do not hesitate to contact us, if you need assistance (see Bridge Support). | true, false | |
| Error Entry State | This column displays the status of the error entry. | New | A new entry of an error or one that has been configured by an admin. |
| Template | An error template. | ||
| Checked | Entry has been checked manually. | ||
| First Occ | This column displays date and time of the first occurrence of this specific error. | ||
| Last Occ | This column documents the most recent occurrence of this specific error. | ||
| Error Count | This column documents how often this specific error occurred (over the whole lifetime of this Bridge instance). | ||
| Threshold | Specifies the count of occurrences that trigger a notification. This setting is related to Always notify and Info Mail. | ||
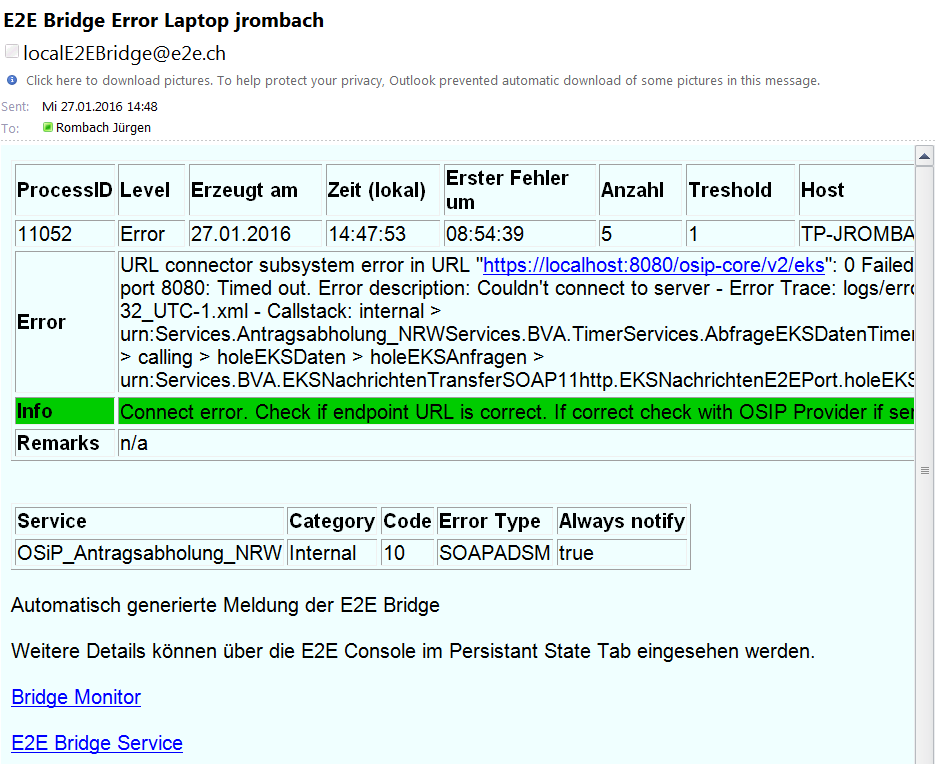
If Info Mail is set to true the Bridge automatically sends a notification email to the configured recipients. It looks like:
For details on all possibilities to configure the error notifications (recipients, ...) refer to Managing Error Definitions below.
The notification mail states an error count: the number of times this error occurred so far this day. At the end of day, this error counter will be reset to 0.
Having a look at the Monitoring UI, you may notice a different error count. The error count of the UI is never reset and states the overall occurrence of the error.
Managing Error Definitions
Modifying an Error Definition
Double-click an error entry on the Service Error List to modify the error configurations. The screenshot below shows the configuration dialog:
Figure: Error Configuration Dialog
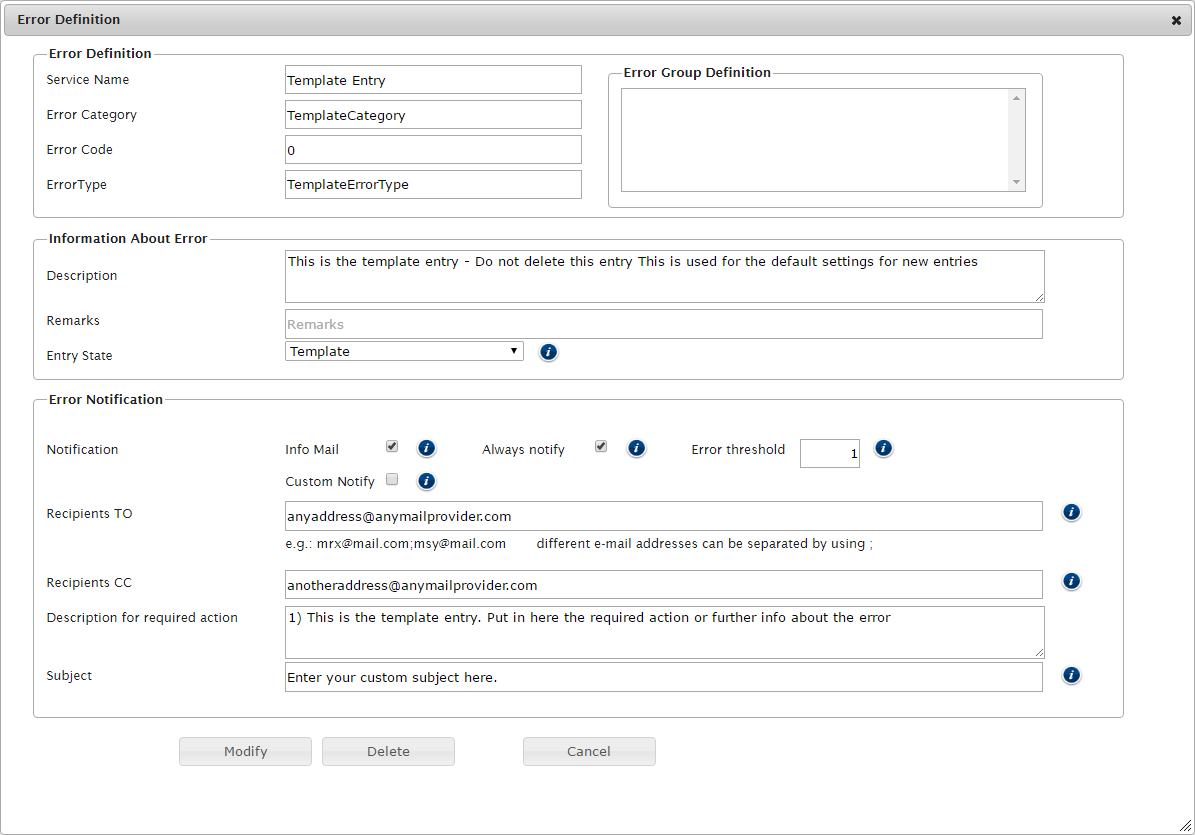
The upper two boxes contain information on the error, i.e. the service that raised it, category, code, description etc.
You can define the specific error handling in the box labelled Error Notification.
| Setting | Description |
|---|---|
| Info Mail | If checked, an email is sent to the recipients configured below. |
| Always notify | If checked, the notification is triggered each time the error threshold is reached. If unchecked, the notification is triggered once per day only. |
| Error threshold | Specifies the count of occurrences that trigger a notification. This setting is related to Always notify and Info Mail. |
| Custom Notify | If checked, a custom notification is triggered. This is a customized extension of the Monitoring Base Service, allowing the integration with other monitoring or ticketing systems like Nagios, JIRA, DataDog etc. |
| Recipients TO | Specify a list of recipients addressed as TO if email notification is used. |
| Recipients CC | Specify a list of recipients addressed as CC if email notification is used . |
| Description for required action | Enter a free text. This text is typically used to give the email recipients detailed instructions about what to do about the error (e.g. "this error indicates that there is a parcel stuck in logistics, please check LogiManager for the parcel ID given in the error description"). |
| Subject | Enter a free text. The subject in this field will replace the default subject defined in the service settings of the Monitoring service (Bridge). You can still overwrite the subject, when an error using this template is thrown. |
Furthermore, in box Error Group Definition you can assign the error to one or more error groups by selecting the groups from the list. To unselect an error group, use Ctrl + click.
Error groups are used for documentation reasons and to specify centralized downtimes. Refer to Managing Error Groups further below for more details on how to add and manage error groups.
Deleting Error Definitions
In the far right column of the error list on the main screen, you can select entries of the error list by a checkbox. Clicking Delete Selection will delete all selected entries.
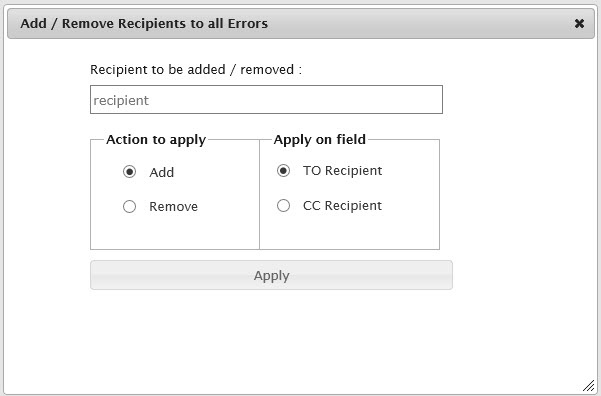
Bulk Change of Error Definitions
Click Add/Remove Recipients to bulk add or remove one recipient (mail address) for all error entries.
Managing Error Groups
All errors can be added to one or more error groups for centralized downtime administration. Click Manage Error Groups on the main screen to manage the error groups.
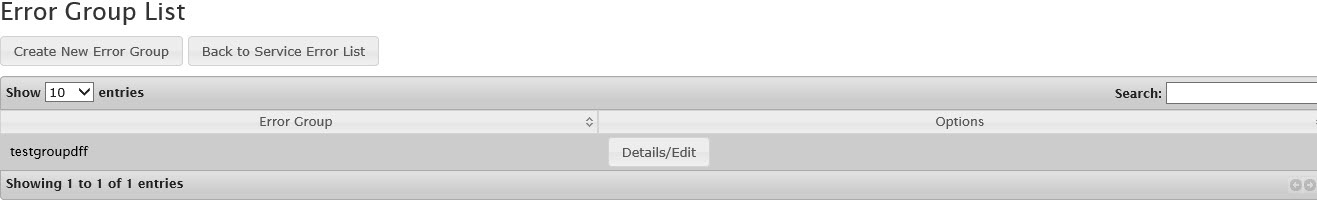
Click Create New Error Group to create a new error group.
Click Details/Edit on an entry of the error group list to inspect the details of an error group, like
- the error members of the group
- the configured downtimes
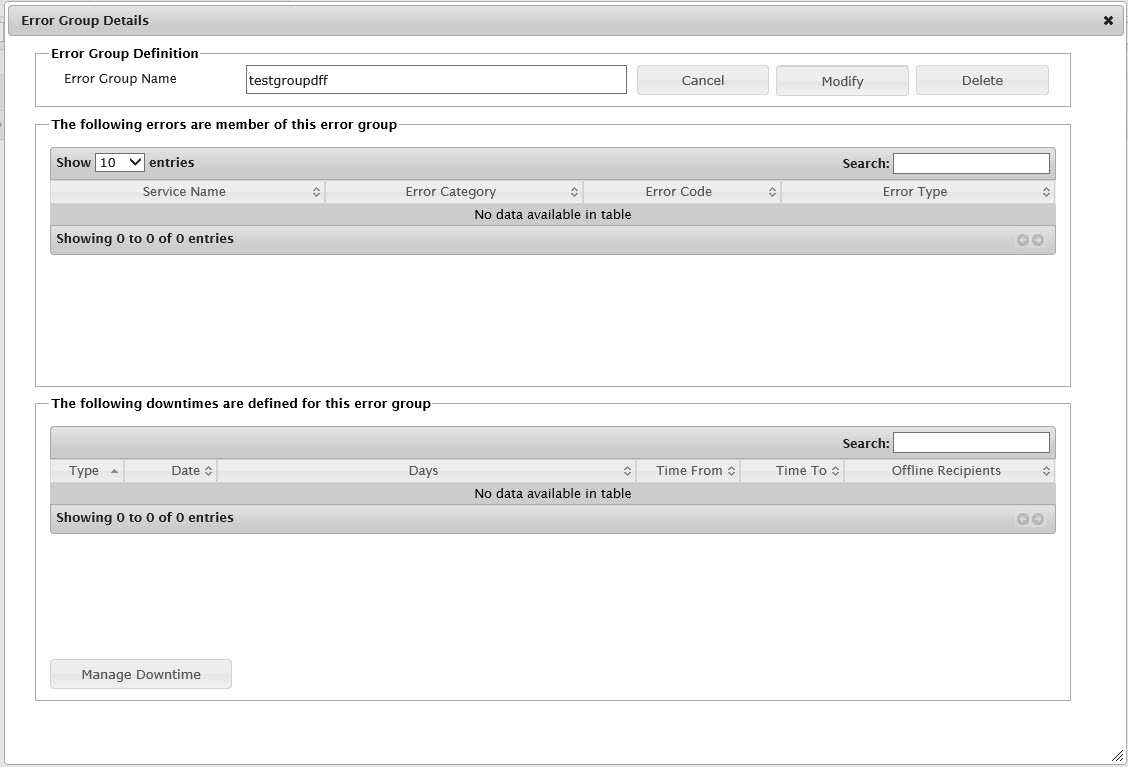
Click Manage Downtime to change the service downtimes for this error group during which occurring errors should not be notified. Refer to Downtimes for more details.
Click Modify to save the changes you made. Click Delete to delete the error group and all assignments to errors.
Downtimes
Downtimes are defined periods of time during which errors should not trigger notifications. E.g. if an SAP system is being updated and will temporarily be unavailable, some services may throw corresponding errors. Since this is known in advance, a downtime for these errors can be configured to avoid the flood of error notifications. Downtimes can be assigned to error groups (see above).
Configuring Downtimes
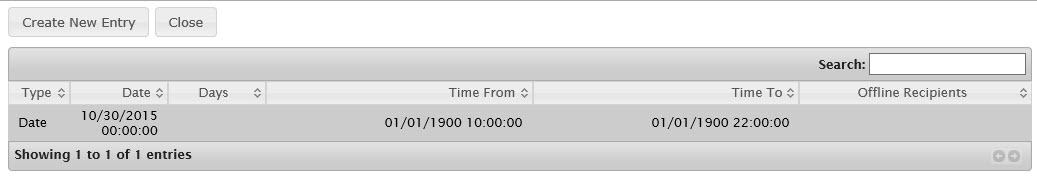 | Click the Downtime button in the list. This will open the list of defined downtimes for the current entry. |
| Clicking Create New Entry will open the dialog to create a new downtime entry. |
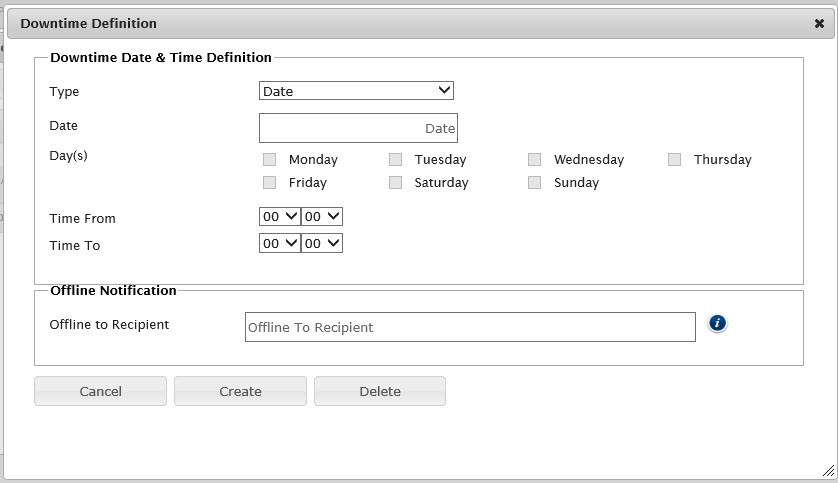
Downtimes can either be created for a certain date, or on a day pattern.
Viewing Downtimes
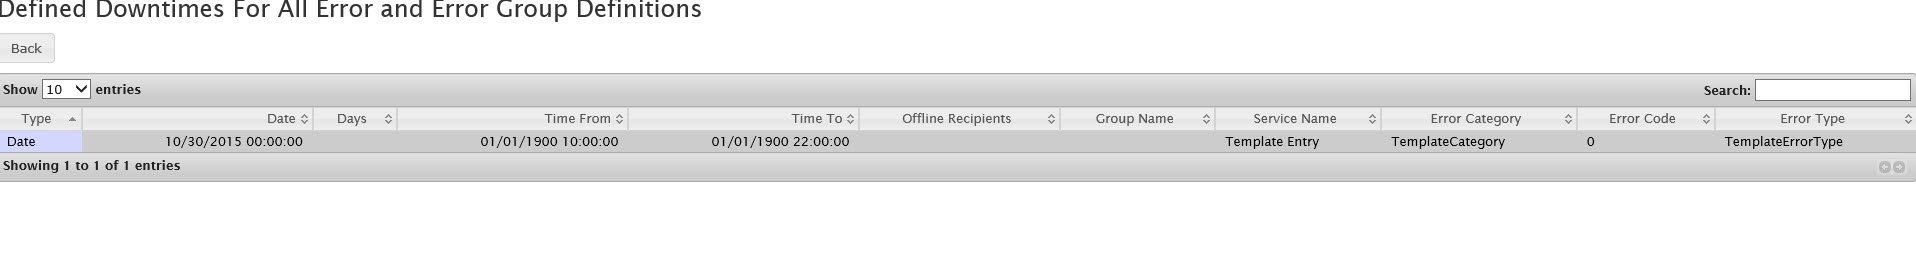
This screen shows all defined downtimes of all services. During this downtimes, no error notifications will be sent for this error.
Viewing the Change Log
This screen simply shows the trace of all changes on Monitoring data sets.
On this Page:
Overview
Content Tools