This option is only available for type xuml-service (= containerized xUML services).
In the administration application you have the possibility to change the log level for a containerized xUML service.
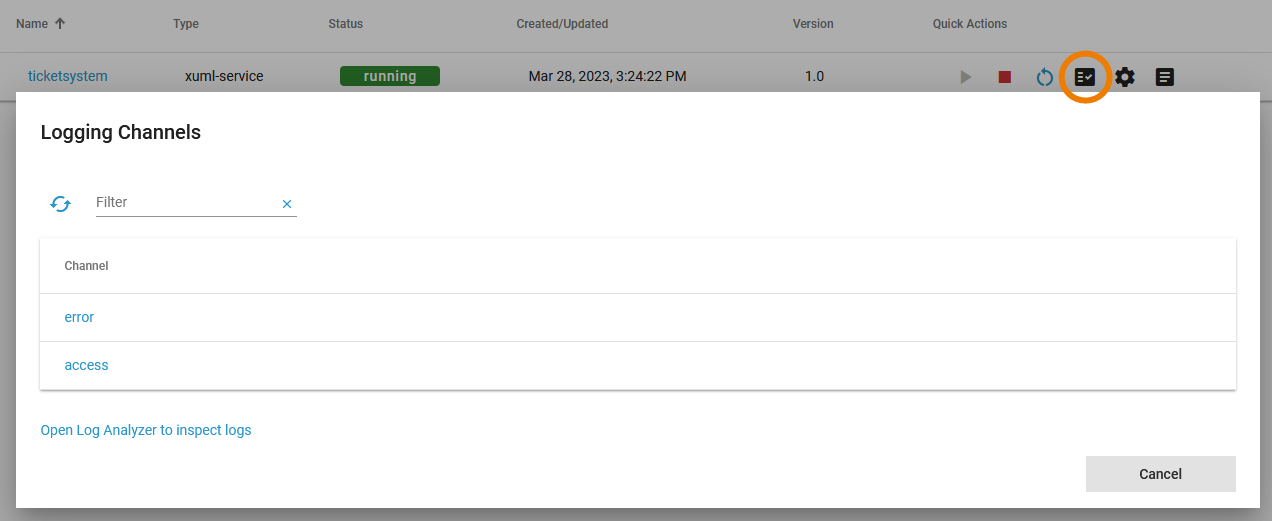
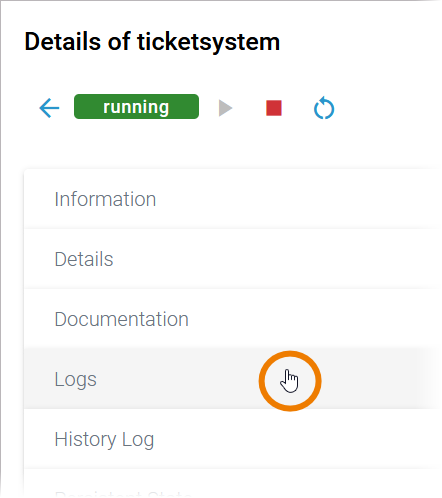
| You have two options to open the input form where you can change the log level:
|
|
|
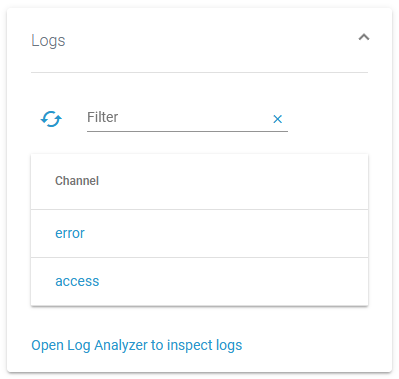
| The logging concept of the xUML Runtime is build around the concepts of channels and sinks. Refer to xUML Runtime Logger Configuration for detailed information. In sections Logs, you can choose between two channels: The link below gives you direct access to the Log Analyzer, refer to Showing Logs of a Containerized xUML Service and Analyzing Platform Logs for further information. |
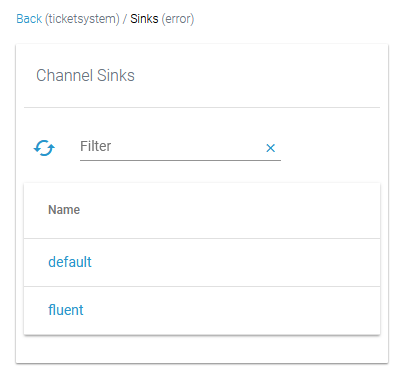
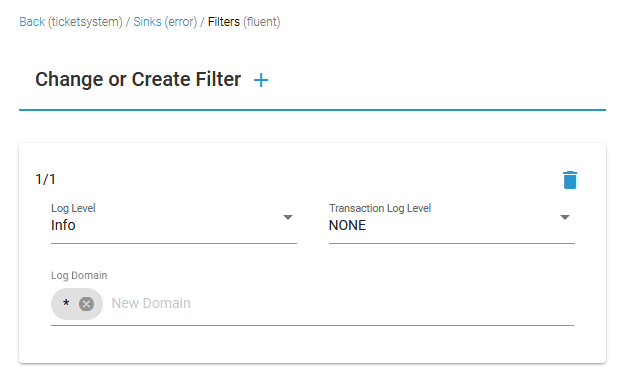
| Select a channel to open the related channel sinks. Sinks define the logging output and how it is written. Refer to xUML Runtime Logger Configuration for detailed information. You can choose between two channel sinks:
|
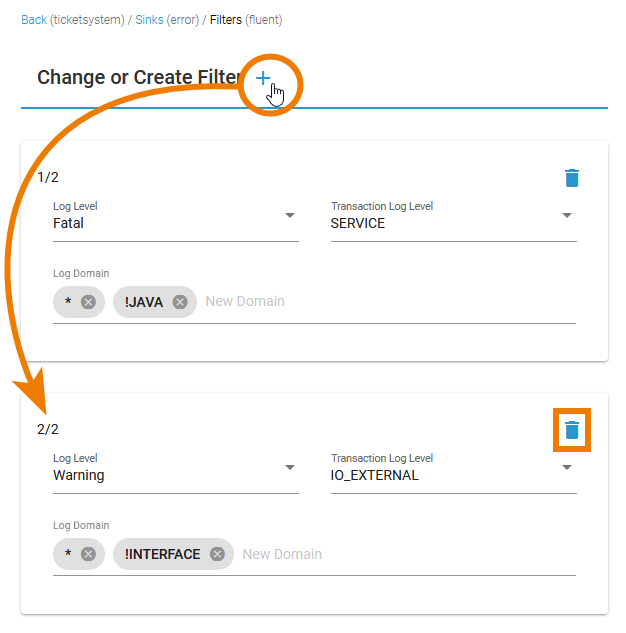
| On the sink level, you can now adapt:
If you have selected log level Debug, a lot of information is logged. It can then be helpful to exclude certain log domains in order to narrow down the number of logs. Refer to Designer Guide > Log Errors for an overview on all error domains and their error codes. Please note that changes of the log level are directly applied to the container. They are effective until a restart or a recreation of the container which is also the case when the service settings are changed. |
| Click Add Click Delete |


Default Retention Time of Log Files
The following retention times are valid for log files of your PAS installation:
- Container logs: Log files inside all containers are deleted after 7 days.
- Log Analyzer (OpenSearch) logs:
- Single cluster: Log files are deleted after 14 days.
- High Availability cluster: Log files are deleted after 30 days.
- Integration (Bridge) logs: The default retention time for Bridge logs is 30 days. This is configurable in the UI, refer to Integration Platform User's Guide > Node Instance Preferences.
Log Levels of an xUML Service
You can set the following log levels for each xUML service. The higher the log level, the more information is written to the log files. The log levels in the table below are cumulative and are ordered from the lowest to the highest log level. For each log level, also the information of the lower levels is logged. Log fatal errors. The service cannot continue its normal execution, e.g. due to repository errors, system limitations like no more available threads or memory. These errors need the intervention of an administrator to solve the problem. In addition to Fatal, non-fatal errors are also logged. These errors are not written if they are caught in the Designer service model, e.g. connection errors, wrong SQL statements, applying operations to invalid values, and so forth. Warnings indicate unexpected but non-critical situations that do not interrupt normal operation. In addition to Info, low-level debug information is also logged. In addition to log level Info, low-level debug information is written into an error file specified in the error message. Furthermore, the full communication stream when using the URL or SOAP adapter is written to the xUML service standard log. For more details on debugging an xUML service, refer to xUML Service Dump. If an error occurred, a call stack is written into the error log exposing the path to the action state where the error occurred in the model.
Log Level
Description
None
No logging at all.
Fatal
Error
Warning
In addition to Error, warnings are also logged.
Info
In addition to Warning, general information is also logged.
This includes, for instance, which component is being started or stopped, loaded add-ons, licensing information, etc.
Debug
Use this log level with care and only when investigating problems. As all tracing information has to be logged, it may result in significant loss of performance with increasing complexity of the deployed xUML service.
[2006-04-20 08:31:13 W. Europe Standard Time][Error] [Internal][FUASM][3][Division by zero - Callstack: calculate > Calculation > call_Division > Division > Divide]
Transaction Log Levels
You can set the following transaction log levels for each xUML service. The higher the log level, the more information is written to the log files. The log levels in the table below are cumulative and are ordered from the lowest to the highest log level. For each log level, also the information of the lower levels is logged. None Logs everything that is written by the logger adapter. For more details, refer to Logger Adapter Reference. Logging also includes start and end time of service calls and can be used to analyze process performance. Refer to Contents of the Transaction Log for a reference page with all transaction log details.
Log Level
Description
No logging executed.
Custom
Service
In addition to Custom, the start and the end of calls to a service operation (service interface) are also logged.
For example, calls to SOAP, SAPRFC, or HTTP operations.
IOExternal
In addition to Service, calls of adapters that communicate with external systems are also logged.
External systems like SAP, SQL, SOAP, etc. For instance, the SQL queries that are sent to the database will be logged as well. Calls via the file system and system adapter are excluded.
IOInternal
In addition to IOExternal, calls of adapters to internal (local) resources are also logged.
E.g. Filesystem Adapter.
On this Page:
Related Pages:
Related Documentation:
Overview
Content Tools