
Remember that the E2E Interactive Debugger allows you to debug models at run-time. For detailed information on the Interactive Debugger see the Builder User's Guide.
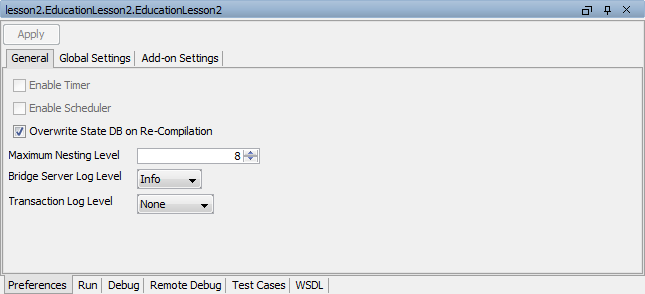
Checking the Services properties
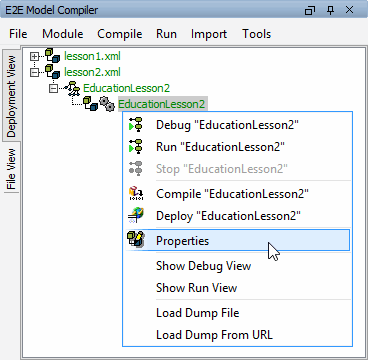
| With the right mouse button click EducationLesson2 in the Deployment View of the Model Compiler and select Properties from the context menu. |
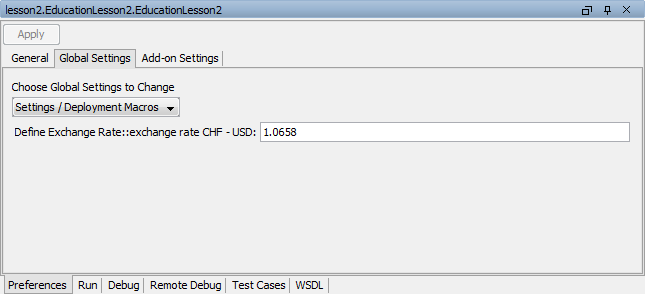
Switch to the Global Settings Tab. The setting exchange rate CHF - USD you defined within the action script of Get Exchange Rate is displayed with its initial value.
The exchange rate may be changed here before starting the service.
Running the Service
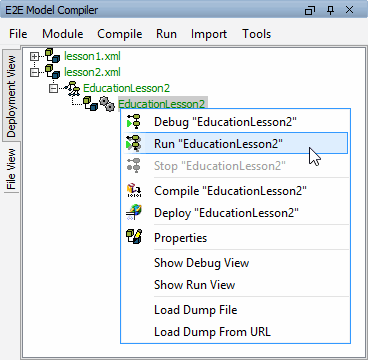
| Select Run "EducationLesson2" from the deployments context menu. |
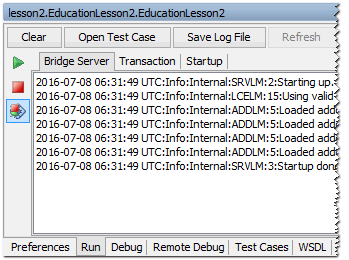
The Runtime window deploys the service to the internal server of the development environment and starts it in the E2E Embedded Runtime. This is logged to the Run view. Remember that using the Embedded Runtime, the service will always be deployed to localhost.
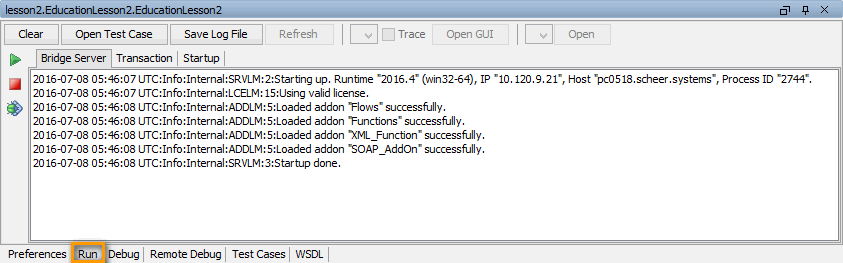
The service is running now and can be tested with the E2E Model Debugger.
Running a Test Case
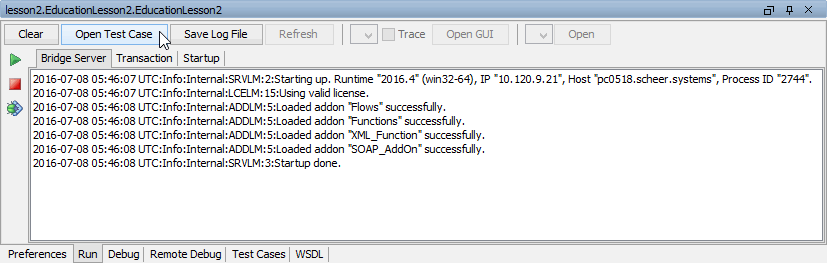
Click Open Test Case in the Runtime window to switch to the E2E SOAP Test Tool in tab Test Cases..
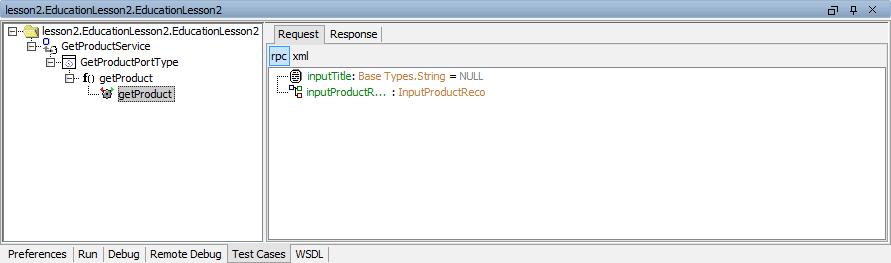
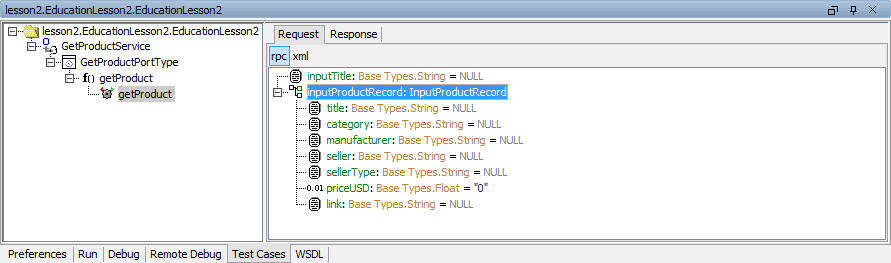
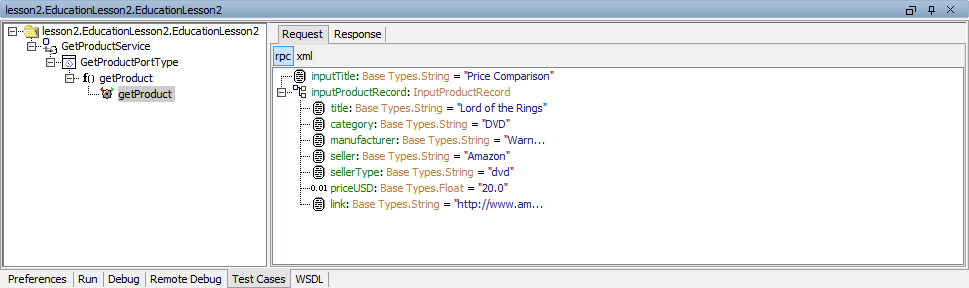
The automatically created test case getProduct is displayed. It is marked with a gearwheel ![]() . The gearwheel in gray color indicates that the test case has not yet been run. On the Request tab in the right panel, both input parameters inputTitle and inputProductRecord are displayed.
. The gearwheel in gray color indicates that the test case has not yet been run. On the Request tab in the right panel, both input parameters inputTitle and inputProductRecord are displayed.
Behind each parameter name, the type and the assigned value are displayed. Initially, the parameters are set to null.
The symbol ![]() indicates a parameter of complex type, the symbol
indicates a parameter of complex type, the symbol ![]() a string.
a string.
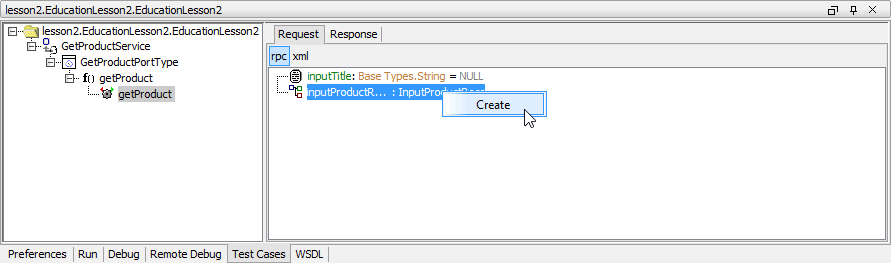
Create the parameter inputProductRecord, which is of complex type. Remember, that parameters of complex type have to be created by a create-statement.
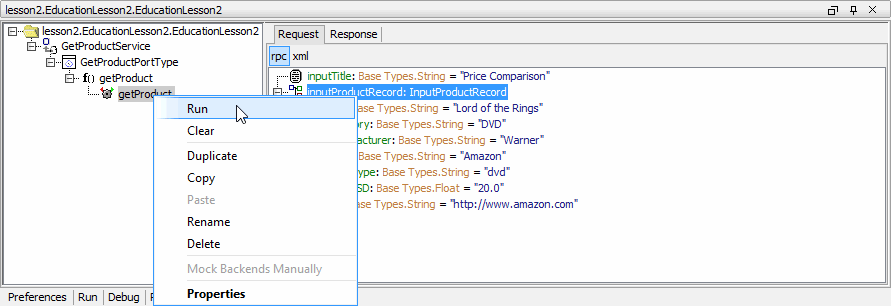
Click it with the right mouse button and select Create.
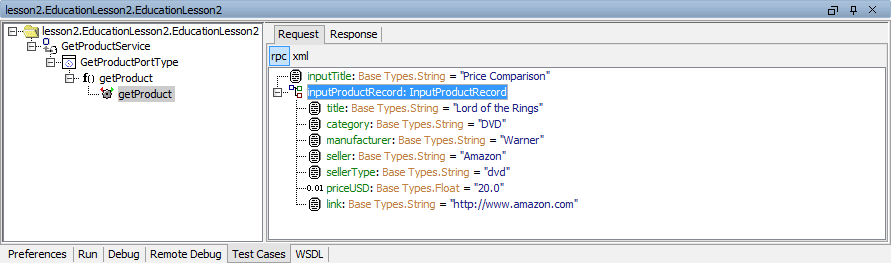
Expand the parameter inputProductRecord in order to open its attributes.
Enter input values in the Request tab as shown below.
Run the test case.
If the test case reports no error, a green gearwheel ![]() will be displayed in front of the test case name. The Model Debugger switches to the Response tab and shows the result.
will be displayed in front of the test case name. The Model Debugger switches to the Response tab and shows the result.
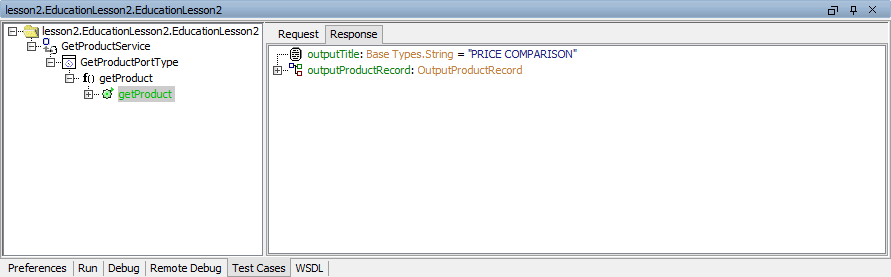
Expand the output object outputProductRecord to inspect the response of the Web service.
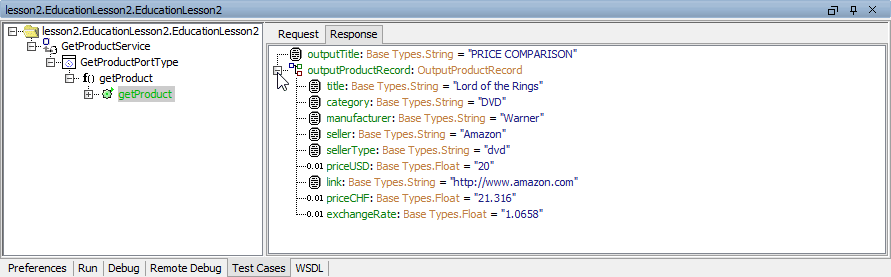
The output objects outputProductRecord and outputTitle have been returned after calling the operation getProduct of the xUML Service EducationLesson2.
The object outputTitle is a string and was reused from lesson 1.
All attributes of your input data are shown in the output object outputProductRecord. Note, that the value of the exchangeRate is also being displayed. It was set in the activity diagram Set Price CHF and Exchange Rate. The price in CHF was also calculated as defined in the action script.
Stepping through the Model with the E2E Interactive Debugger
In this chapter, you are going to step through the lesson 2 model with the E2E Interactive Debugger to recall the features of the debugging tool.
Start the service in debug mode. If you do not stop the running service before, the runtime will stop the service and restart it in debug mode.
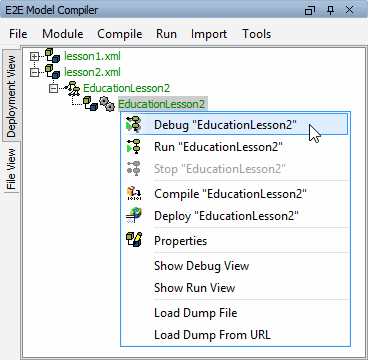
| You can either select Debug "EducationLesson2" from the context menu of EducationLesson2 in the Deployment View of the Model Compiler, or ... |
| ... switch to the Debug tab in the Runtime window and click the button |
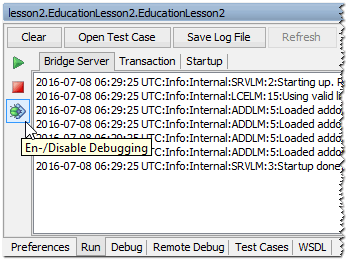
| If the service is still running, you may also switch to the Run tab and click the debug button The service will switch to debug mode without restarting. |
| The icon of the button changes |
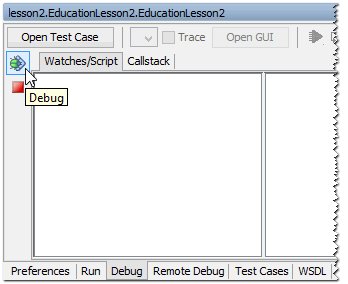
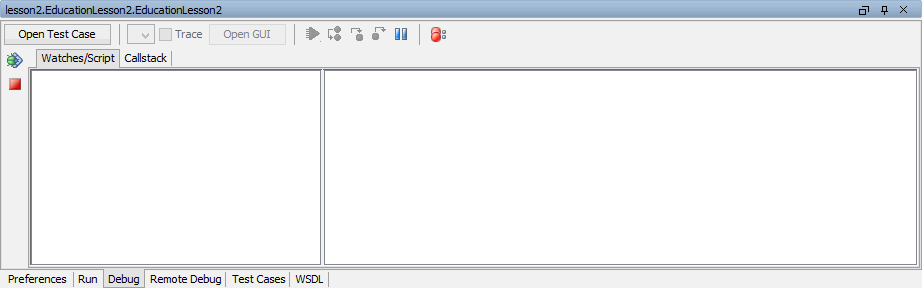
After starting the service in debug mode, the Runtime window switches to the Debug tab and shows the debugger waiting for commands.
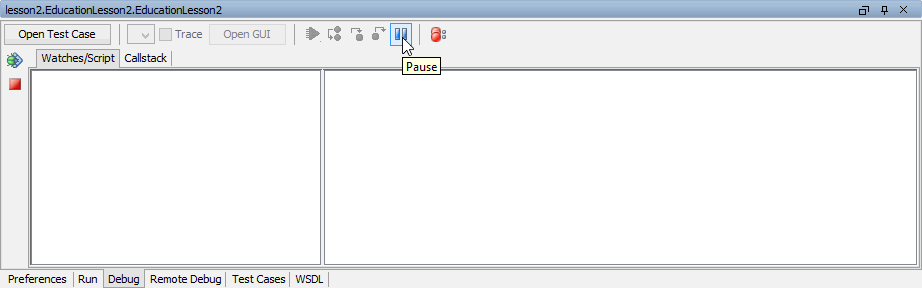
Click the pause button ![]() . The interactive debugger will pause the service at the next possible point: if the test case has not been started yet, this means the very first action of the service.
. The interactive debugger will pause the service at the next possible point: if the test case has not been started yet, this means the very first action of the service.
Click Open Test Case to switch to the Test Cases tab. You can see the test case getProduct and its test case data.
Run the test case again.
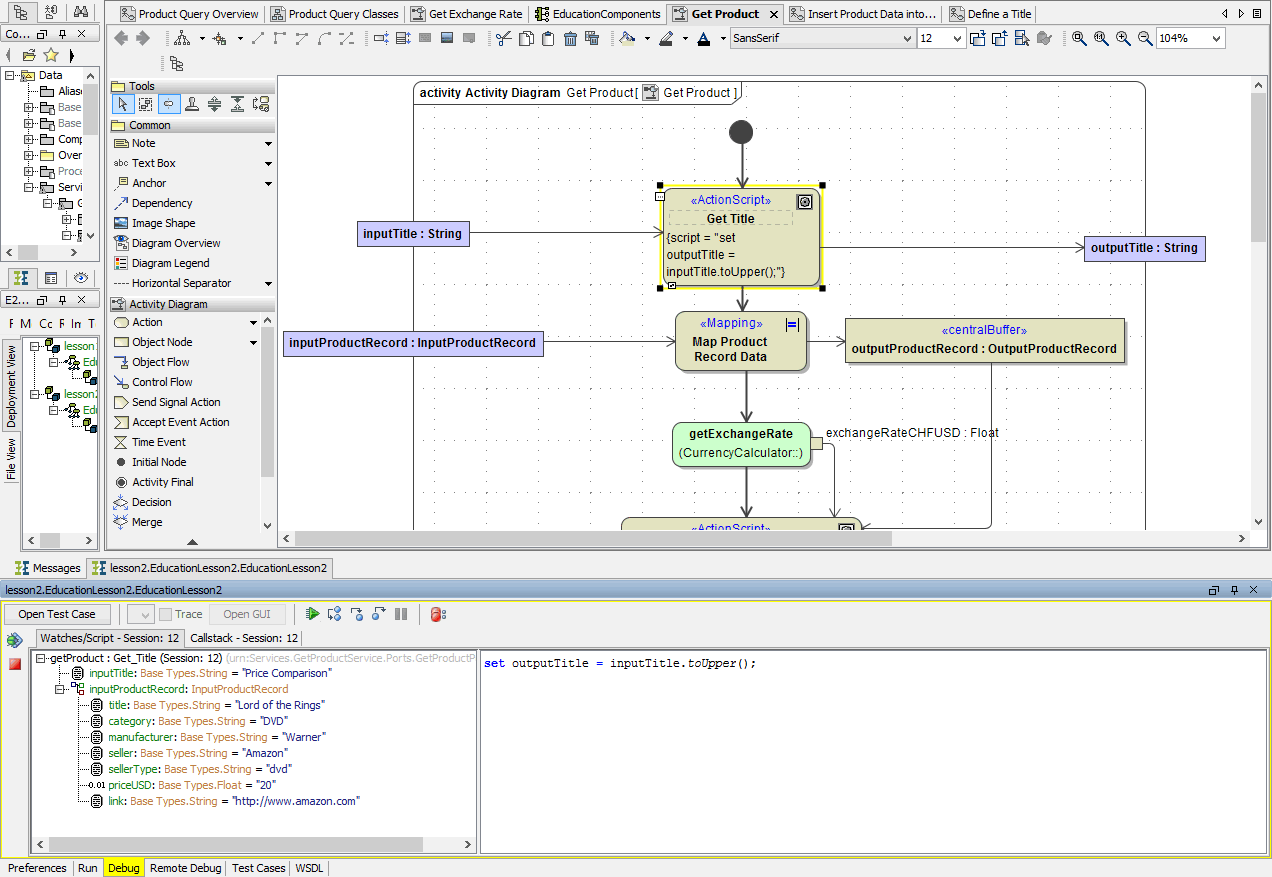
The Runtime window switches back to the Debug tab (which is now highlighted in yellow) and the service has been paused on its first activity Get Title.
Click Step into ![]() .
.
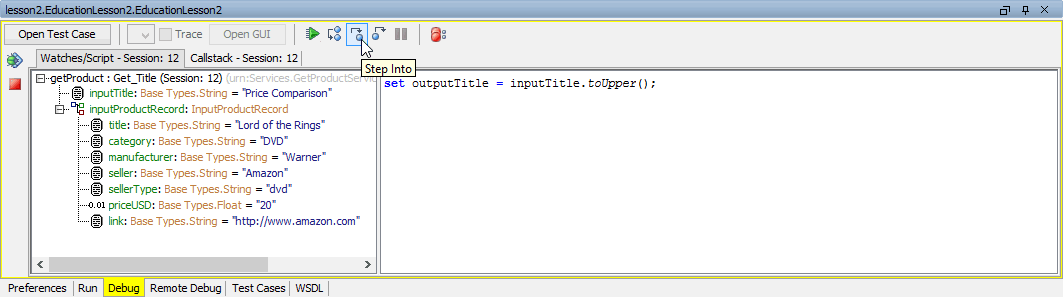
In the watches part in left panel of the debug window, you can see the input values. In the right panel, the debugger displays the action script statement highlighted that will be executed next: set outputTitle = inputTitle.toUpper();
Click Step Into ![]() .
.
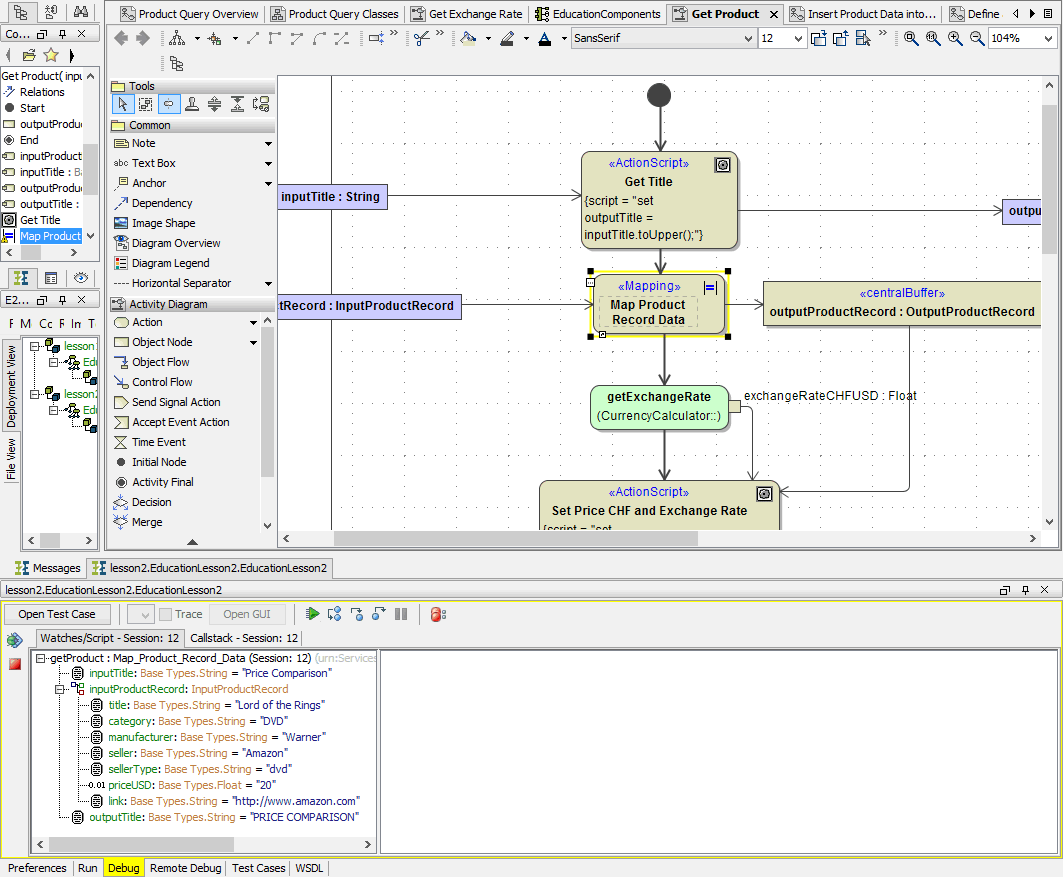
In the watches panel note the additional object outputTitle that was created by the action script statement. It contains the value of inputTitle converted to upper case.
As the action script contained only one statement and there were no further statements to step into, the step into command resulted in switching to the next action node Map Product Record Data.
Click Step Over ![]() as it is not possible to step through the mapping statements.
as it is not possible to step through the mapping statements.
Clicking Step Into ![]() in cases when it is not possible to step into or through an action script, the debugger automatically uses the corresponding possible command, e.g. Step Over
in cases when it is not possible to step into or through an action script, the debugger automatically uses the corresponding possible command, e.g. Step Over ![]() or Go Up
or Go Up ![]() .
.
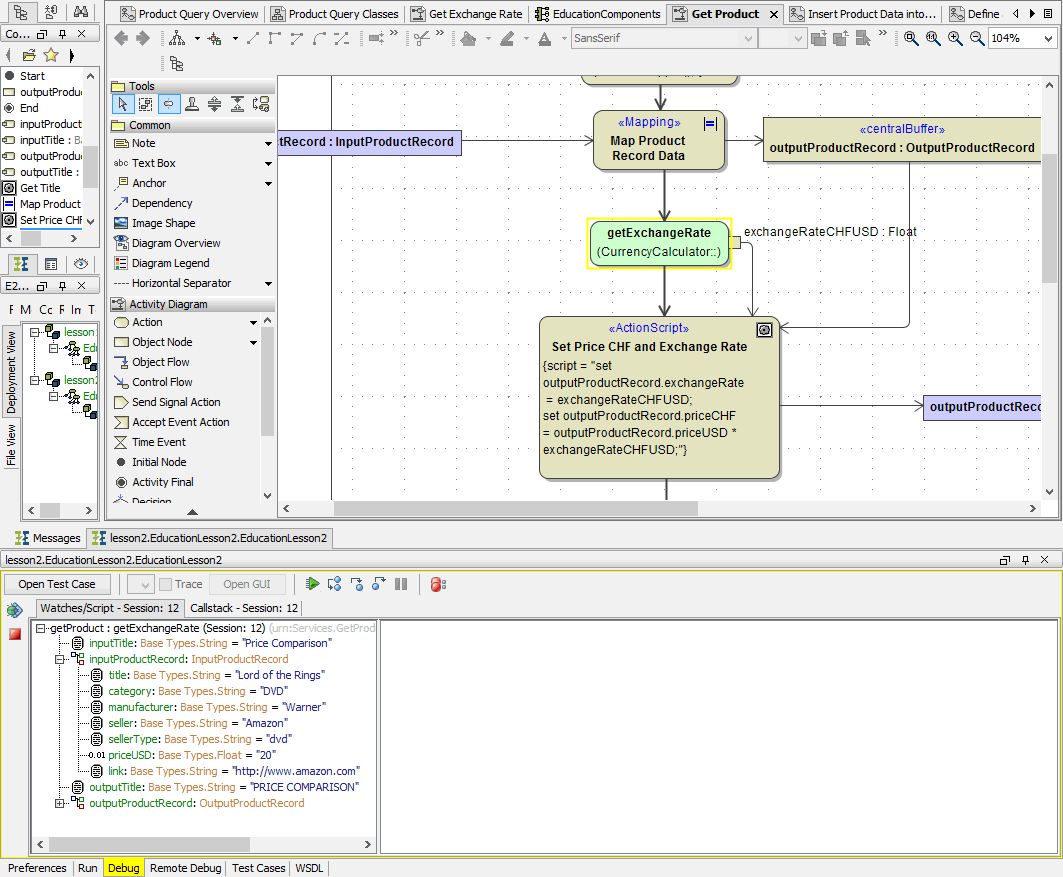
The watches panel displays the mapped data in outputProductRecord. In the activity diagram of activity Get Title the debug focus switched to the call operation action getExchangeRate.
Click Step Into ![]() .
.
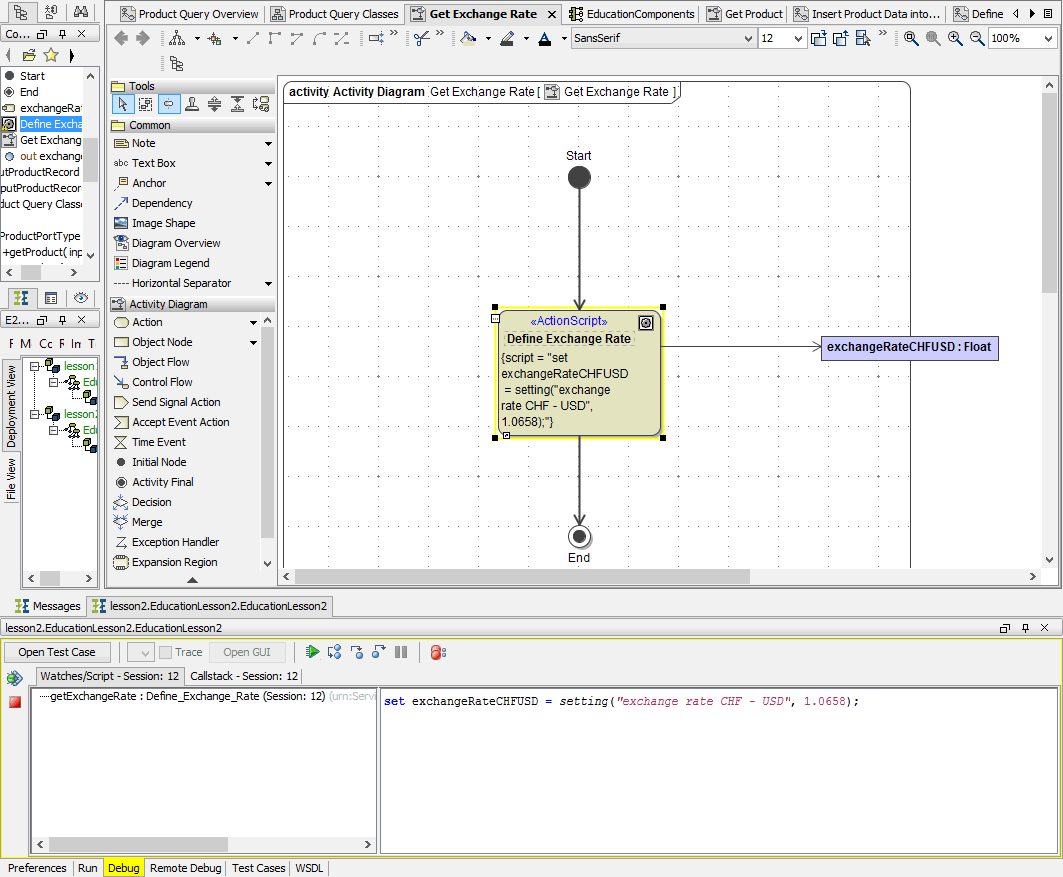
The call operation action getExchangeRate was implemented in activity diagram Get Exchange Rate. As you stepped into the call operation action, the debugger switched to the corresponding activity diagram in the diagram pane.
In the script panel of the debug window, note the action script statement to be executed next.
Click Step Into ![]() twice - first to step into the action node and second to execute the action script statement.
twice - first to step into the action node and second to execute the action script statement.
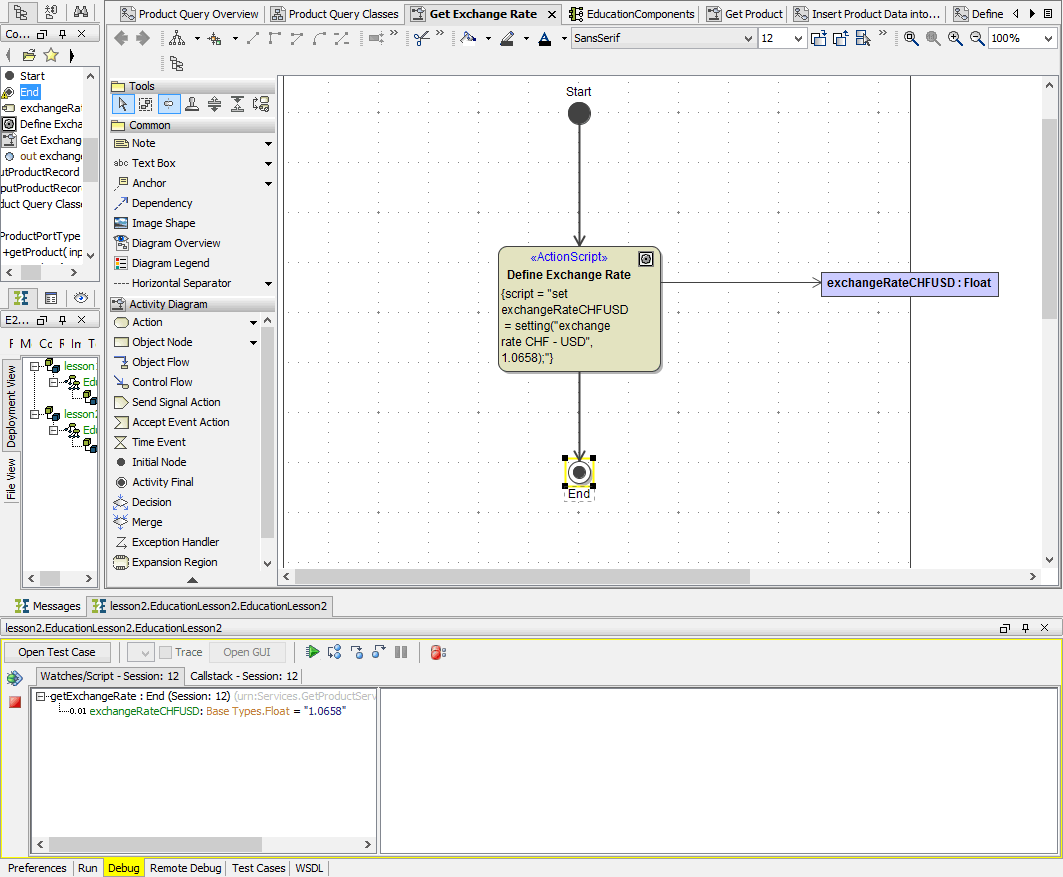
The debugger pauses on the activity final node and displays the result of the action script statement.
Click Step Into ![]() or Go Up
or Go Up ![]() . The debugger will go up to the caller activity diagram and wait on the next action node.
. The debugger will go up to the caller activity diagram and wait on the next action node.
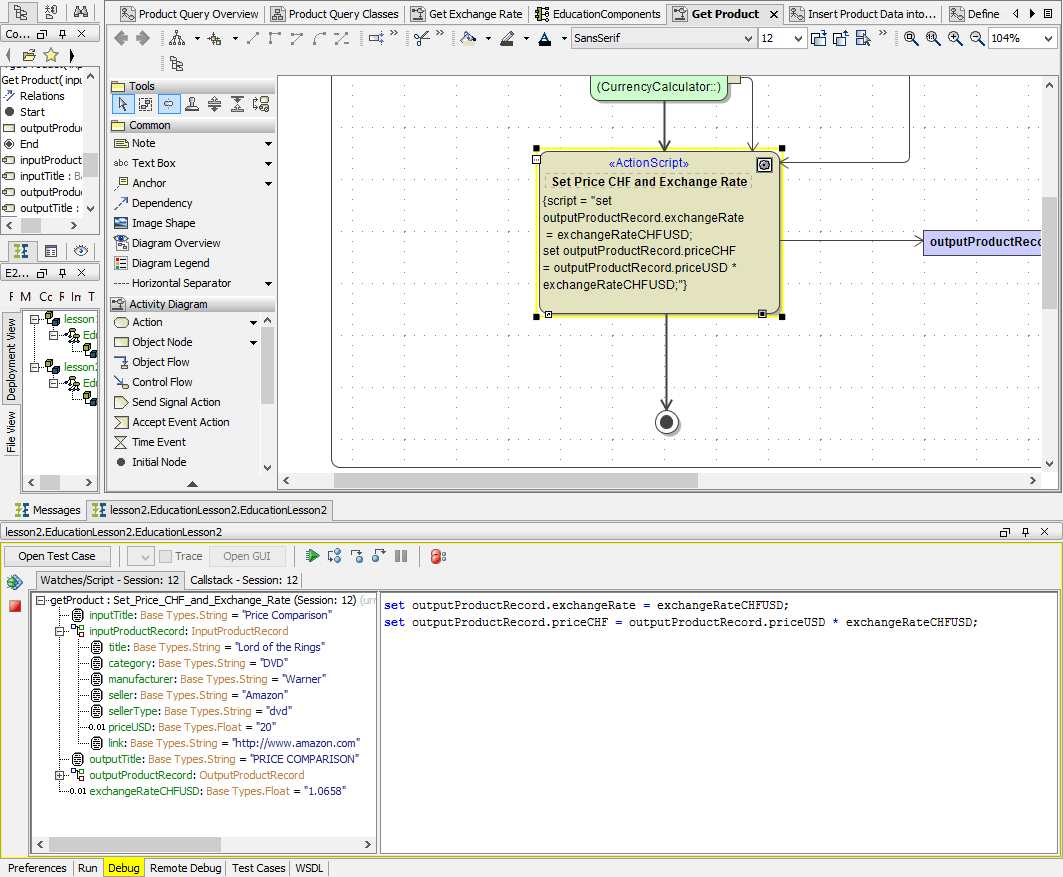
Click Step Over ![]() .
.
The debugger pauses on the activity final of the activity diagram.
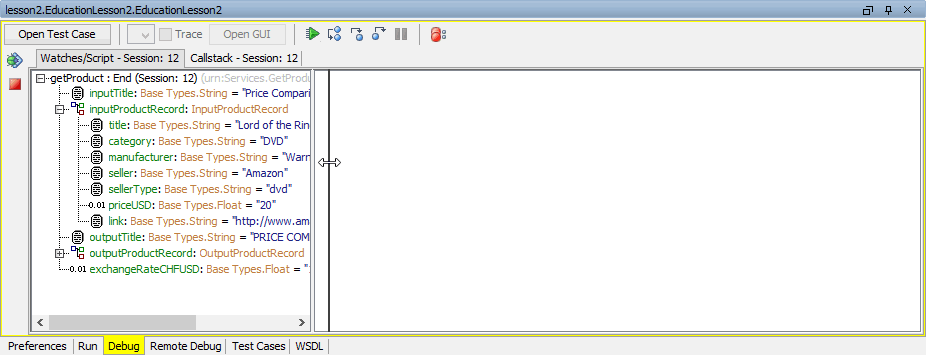
Resize the watches panel to have a better look at the displayed objects. Move the mouse cursor over the line separating the watches and the script part of the debug window. Drag the separator to the left until you can see all object values.
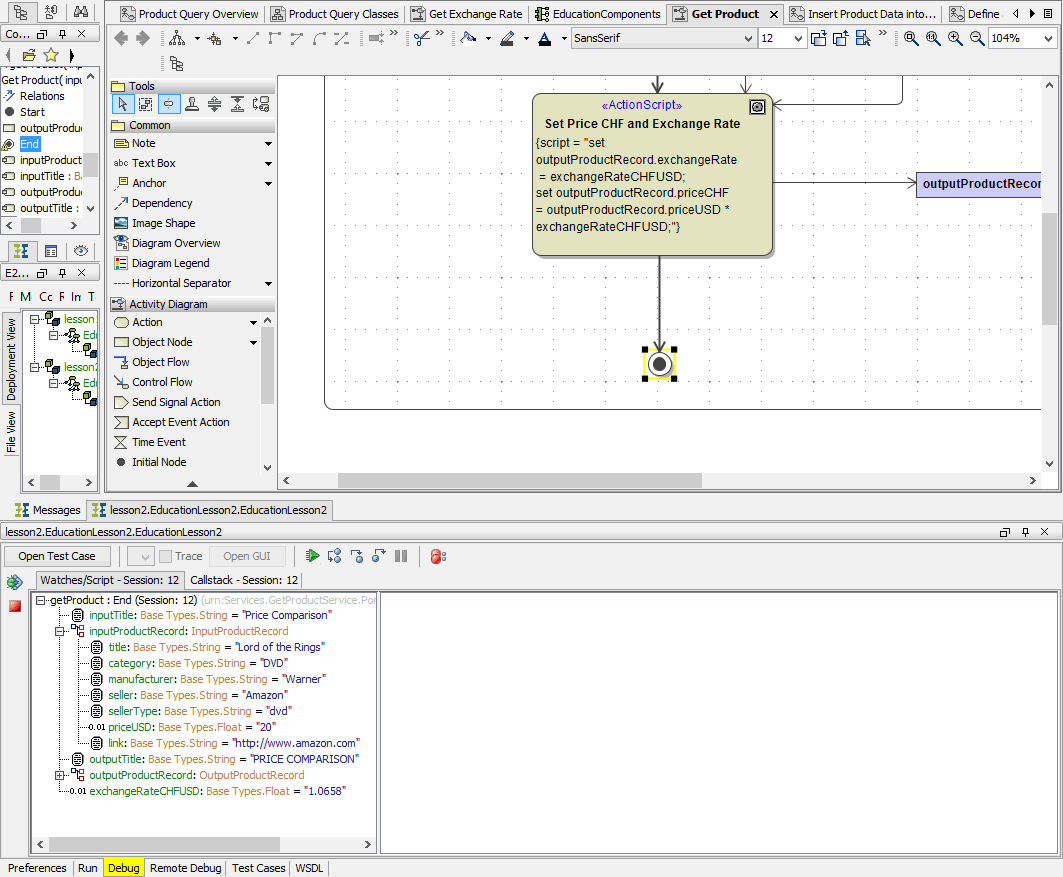
Click Go To Next Breakpoint ![]() . As you set no breakpoints in the model, the service runs to its end.
. As you set no breakpoints in the model, the service runs to its end.

On this Page:
Overview
Content Tools