Remember that E2E Analyzer is the interface to the trace feature with which you can test all operations on the fly. It traces the execution path of a service that is run through the test. You can view this path graphically, e.g. in order to debug Web services or verify their correct functioning. Each operation defined on a port type can be tested with this tool. It makes no difference whether the service is running in the E2E Embedded Runtime or has been deployed to a server.
For detailed information on the E2E Analyzer and it's features see the ANALYZER User's Guide.
If you want to try out the Analyzer, refer to the Analyzer Installation Guide. There you will also find a link for downloading the Analyzer from the E2E homepage.
Starting the Service and the Analyzer
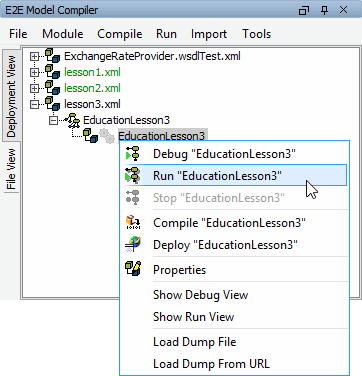
| Start the education service of lesson 3 in the Embedded Runtime and start the E2E Analyzer. |
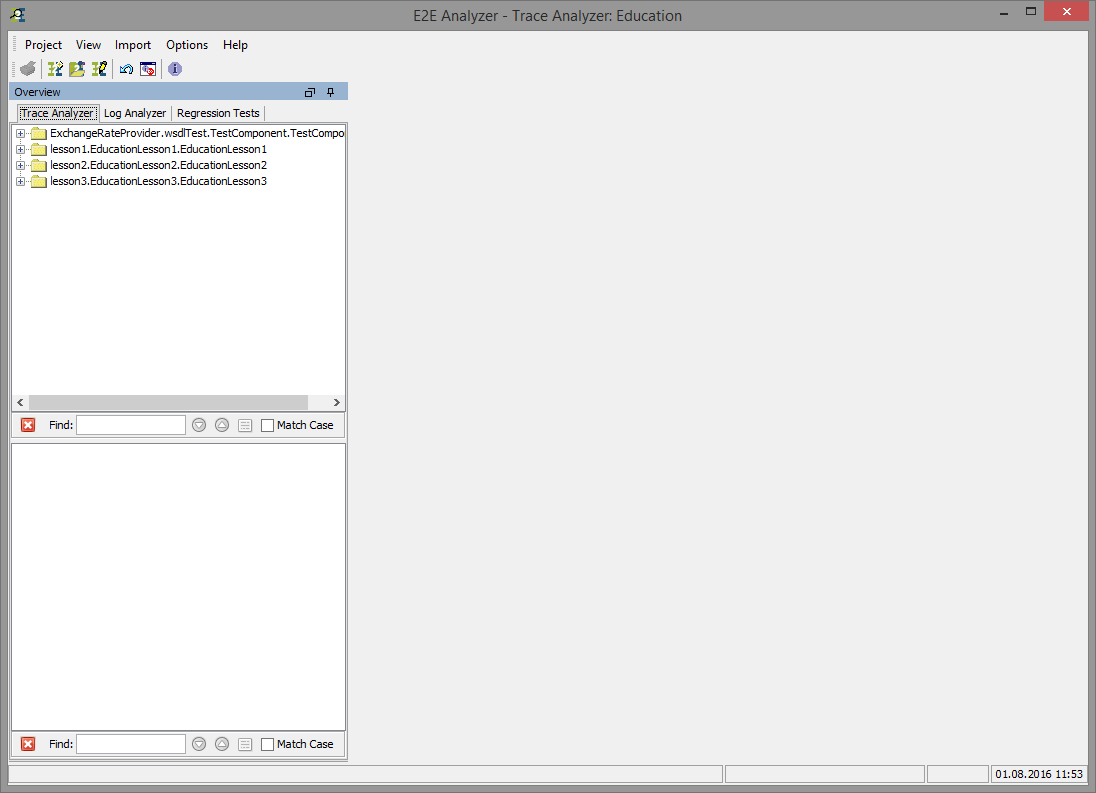
As you have used the Analyzer before with lesson2, E2E Builder Project Education reopens automatically.
Expand the tree of the lesson3 service lesson3.EducationLesson3.EducationLesson3.
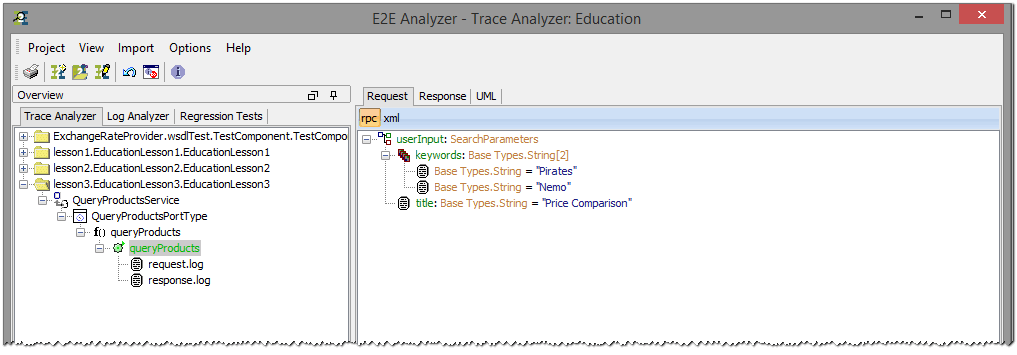
You can see the request and response log from the earlier running of the test case with the E2E SOAP Test Tool.

Overview
Content Tools