E2E provides a standard implementation of the Monitoring Service. In general, notifications are sent by email and/or any other custom notification scheme, which can be configured using the Monitoring UI service. The standard E2E Monitoring service (E2EMailJiraMonitoring) puts JIRA as the custom notification scheme. However, alternative custom notifications schemes can be implemented as well. The bulk of the required functionality is implemented in a xUML library libMonitoring. The BPMN diagram below illustrates the overall process (click to enlarge):
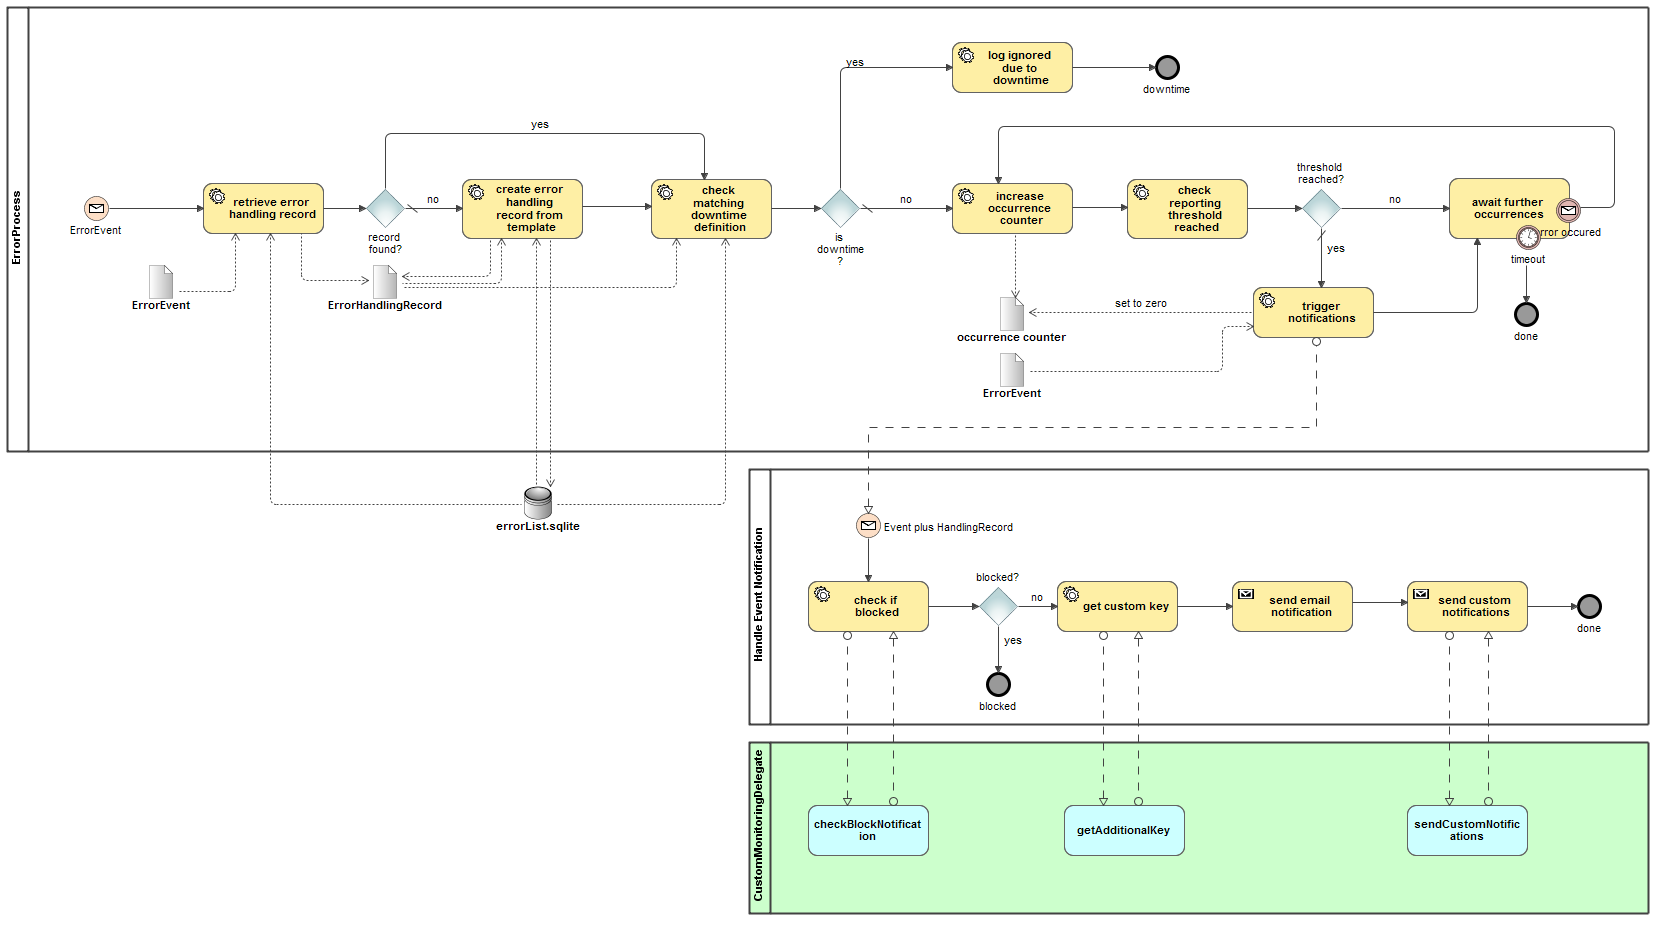
When the E2E Bridge sends an error to be notified, the notification port first performs a couple of checks (i.e. whether a dedicated handling record exists, whether a downtime has been configured, whether the occurrence counter reached the threshold for reporting). In case these checks all go fine, the notification sub process is started. This sub process defines three extension points for custom notifications:
-
checkBlockNotification: return true to suppress the notification of this error
-
getAdditionalKey: provide a string value, which will be included in the email notification as additional key
-
sendCustomNotifications: perform any custom notification you want
The mechanism by which these extension points are called is by means of a CustomMonitoringDelegate class which you have to provide in your custom monitoring service.
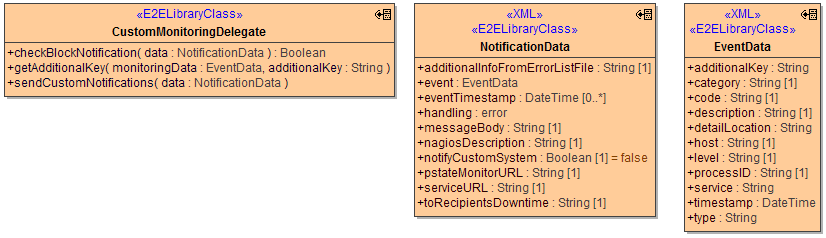
Implementing the CustomMonitoringDelegate
The CustomMonitoringDelegate shall implement three methods, which get the notification in question as parameter. See the below class diagram for an overview:
|
Operation |
Parameter |
Type |
Direction |
Description |
Values/Example |
|
|---|---|---|---|---|---|---|
|
checkBlockNotification |
data |
NotificationData |
in |
Contains the notification data. |
|
|
|
block |
Boolean |
out |
Use this flag to block the notification from being sent (default = false). |
false |
Do not block notifications (default). |
|
|
true |
Block notifications. |
|||||
|
getAdditionalKey |
monitoringData |
EventData |
in |
Contains the event data. |
|
|
|
additionalKey |
String |
out |
Used to return a string that will be added in the monitoring email as an additional key (default = none) |
a valid string |
||
|
sendCustomNotifications |
data |
NotificationData |
in |
Contains the notification data for your custom notification handling. |
|
|
In most cases, the content of the EventData (which can be accessed through the NotificationData instance) instance shall suffice. On some rare occasions, additional information which is internally held in the NotificationData structure might be useful as well, so we decided to provide it as parameter, even if most of its attributes will be irrelevant for the task at hand.
|
Class |
Attribute Name |
Type |
Description |
|---|---|---|---|
|
EventData |
service |
String |
Name of the service that originally has thrown the error. |
|
type |
String |
Error type. |
|
|
code |
String |
Error code. |
|
|
additionalKey |
String |
Additional key for persistent state error objects. |
|
|
level |
String |
Error log level. |
|
|
category |
String |
Error category. |
|
|
host |
String |
Host name where the error occurred. |
|
|
timestamp |
DateTime |
Timestamp when the error occurred. |
|
|
processID |
String |
ID of the process in which the error occurred. |
|
|
detailLocation |
String |
Location of the logfile the error originally was logged to. |
|
|
description |
String |
Error description. |
|
|
NotificationData |
nagiosDescription |
String |
Description for the Nagios command (only used with Nagios). |
|
additionalInfoFromErrorListFile |
String |
Additional values for this specific error (threshold, remarks).
Usage of the Monitoring UI ). |
|
|
event |
EventData |
Specifies the EventData object to be notified. |
|
|
eventTimestamp |
Array of DateTime |
Timestamp when the error occurred. |
|
|
handling |
error |
The error object that lead to this event. |
|
|
messageBody |
String |
The body of the email message that will be sent. |
|
|
nagiosDescription |
String |
The description for the Nagios command (only used with Nagios). |
|
|
notifyCustomSystem |
Boolean |
The configuration setting, telling if custom notification is requested for this error. |
|
|
pstateMonitorURL |
String |
URL of the corresponding persistent state object. |
|
|
serviceURL |
String |
URL of the service that originally threw the error. |
|
|
toRecipientsDowntime |
String |
List of recipients configured to be notified in case of downtime. |
Setting up Your Custom Monitoring Service
In order to setup your custom monitoring service, you have to perform the following steps:
-
Create a new E2E model.
-
Import libMonitoring.lrep (provided by E2E).
-
Create your delegate, inheriting from the CustomMonitoringDelegate class provided in the library.e.g. MyMonitoringDelegate, Base Classifier libMonitoring::MonitoringService::Delegates::CustomMonitoringDelegateOverride the three methods mentioned above to suit your needs.
-
Create your delegate factory, implementing the CustomMonitoringDelegateFactory interface provided in the library.e.g. MyMonitoringDelegateFactory, Realized Interface libMonitoring::MonitoringService::Delegates::CustomMonitoringDelegateFactoryImplement the createDelegate method, in which you create an instance of MyMonitoringDelegate and return it as output.
-
Create a service start up activity.
Create an activity, e.g. onServiceStartup.In this activityCreate an instance settings of libMonitoring::MonitoringService::CustomMonitoringSettings.Create an instance factory of your MyMonitoringDelegateFactory.Use the memory adapter to globally store the factory under key settings.delegateFactoryKey. -
Create a component diagram for your service, and at least
Create E2ESOAPService MonitoringService on port 19000, and assign the library E2ESOAPPortType MonitoringPort to it.Create E2ESOAPService MonitoringServiceUI on port 19002, and assign the library E2ESOAPPortType MonitoringUIDBHandling to it.Create E2ESOAPService MonitoringInfoService on port 19003, and assign the library E2ESOAPPortType InfoPort to it.Select Aliases/Resources libMonitoring and MailLibrary.On the E2EComposite, select your startup activity in the attribute startupActicity.Create any additional services you may have created ports for.Select any additional resources you may have defined/imported.
The service name and port number scheme used in the component diagram ensures backwards compatibility with previous versions of Monitoring services. You are free to assign different names and ports, but this will require you to adjust the SOAP client settings on the Monitoring UI as well as the Monitoring SOAP port settings on the E2E Bridge.