Adding Diagrams
The first menu in the sidebar of the Process Mining view is the Processes menu. A process list is displayed in the content area. The list shows all processes of your system that provide data to Process Mining:
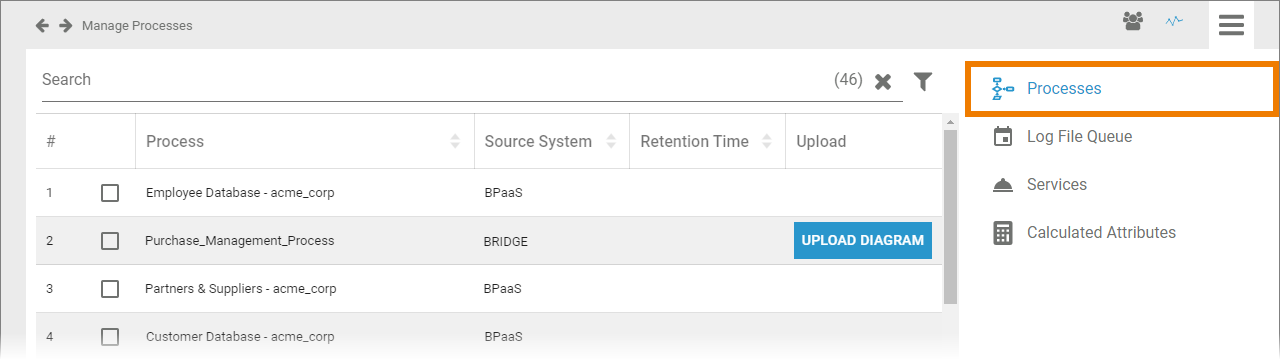
For processes whose data is supplied from the Bridge, you can subsequently upload a suitable process diagram.
The process list contains the following information:
Column Name | Description |
|---|---|
Process | Name of the process in your system. |
Source System | Name of the PAS component providing the data (BPaaS or Bridge). |
Retention Time | Retention time set for the instances of this process. |
Upload | The Upload Diagram button allows you to add a BPMN diagram to Bridge processes. |
Use the Filter to limit the content of the list.
Adding a Diagram to a Bridge Process
You can subsequently add a BPMN diagram to a Bridge process. Select the process in the list and click the Upload Diagram button. Choose the file you want to add and confirm:
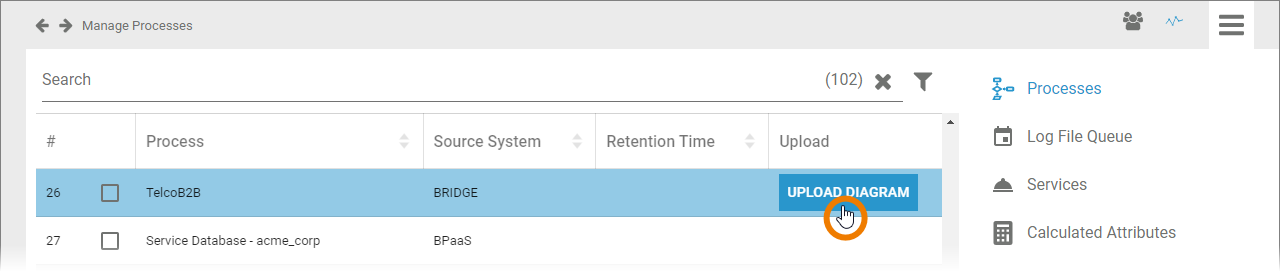
The supported format is .svg.
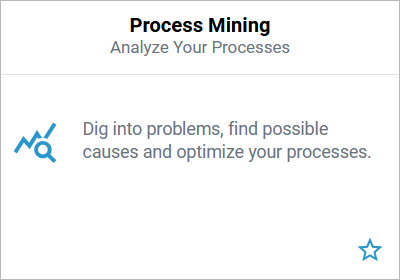
To show the diagram, open the Process Mining component:
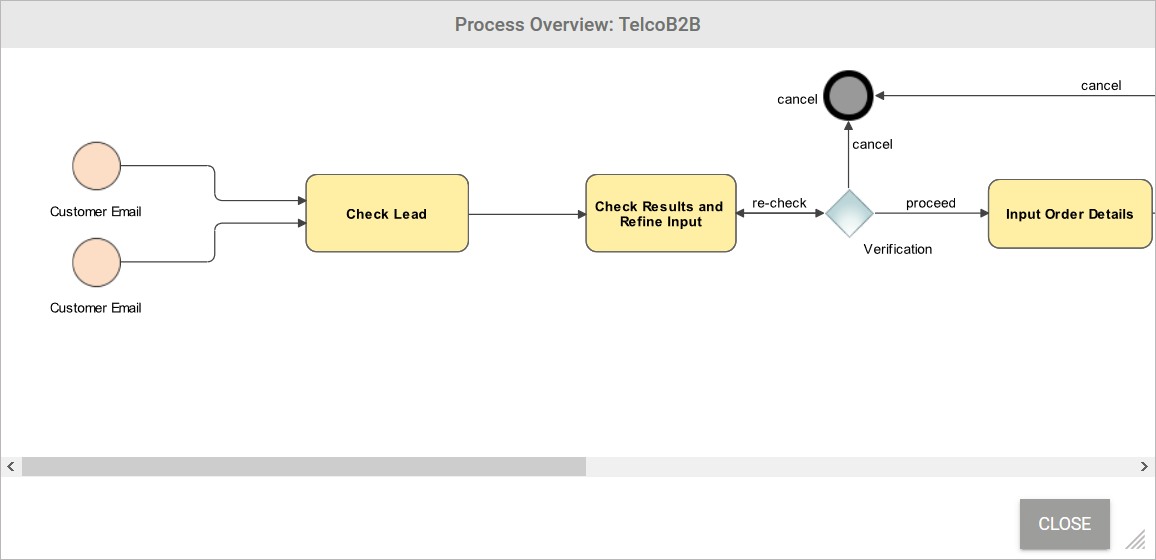
Go to an analysis that uses the process and select option Show process overview in the the analysis menu:
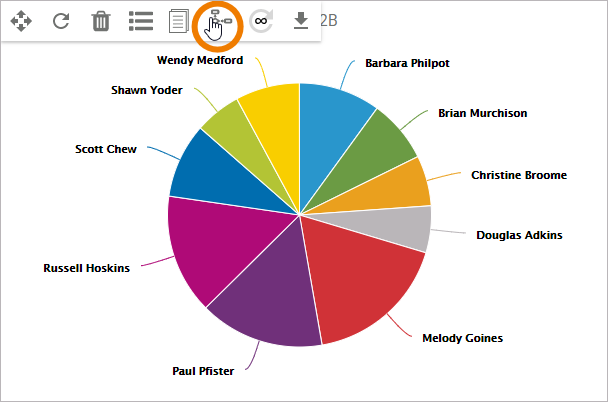
The uploaded BPMN diagram will then be displayed:
Related Documentation: