Use the Log Analyzer to view, filter and search the platform logs for all services. The Scheer PAS Log Analyzer uses OpenSearch to analyze the platform logs.
Acessing the Log Analyzer
| You can access the log analyzer via the corresponding tile in the Scheer PAS Portal. Only users with profile kibana_user are able to see the tile in the portal. |
| If you click the log analyzer tile, the tool will open within the portal. You can also open the log analyzer in a separate browser tab. To do so, use the icon |
Analyzing Data
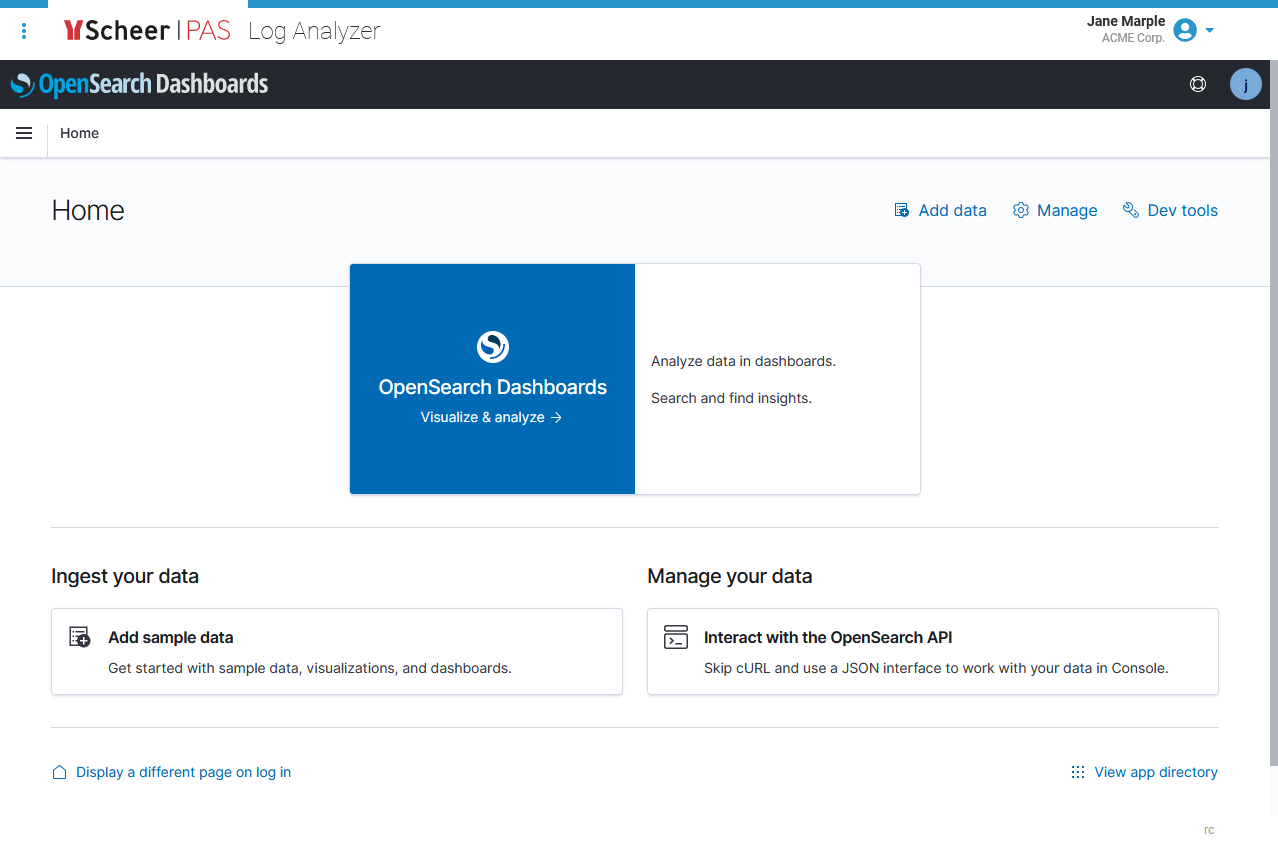
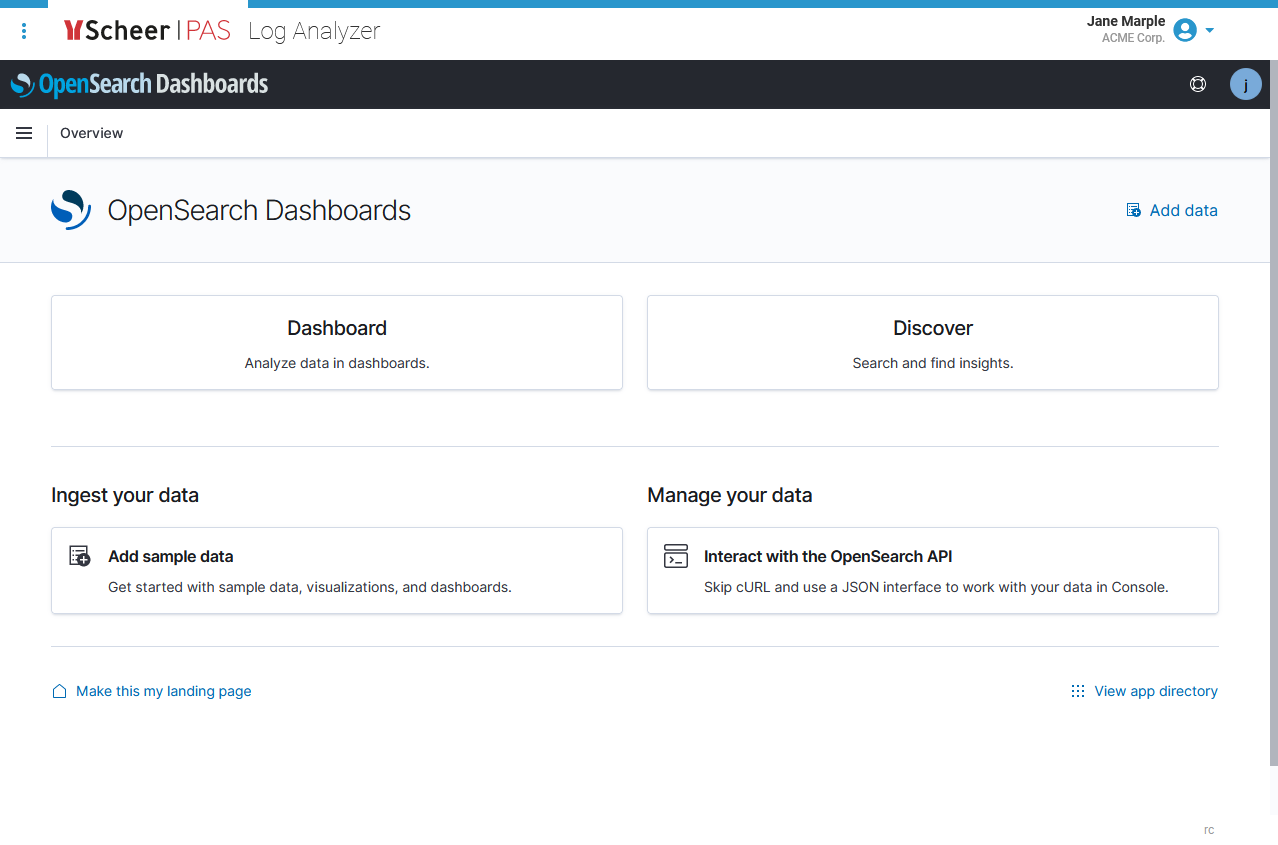
| The Scheer PAS Log Analyzer uses OpenSearch as data storage and OpenSearch Dashboards to analyze the logs of all services. OpenSearch Dashboards is an open source analytics and visualization tool. You can search, view, and interact with data stored in OpenSearch indices. You can perform advanced data analysis and visualize your data in a variety of charts, tables, and maps in customized dashboards. |
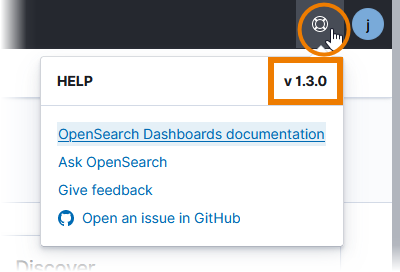
| For detailed information on OpenSearch, its features and how to use them, refer to the Official OpenSearch Documentation. Please note that the official documentation may vary according to different versions of the tool. Before consulting the documentation, check your OpenSearch version. It is displayed if you open the help menu |
Creating an Index Pattern
The log analyzer needs to knows which indices contain the data you want to analyze. So you have to create an index pattern first to make sure that data is available. If your log analyzer is empty and does not contain an index pattern yet, it asks you to create one. You need to do this only once after the first login, then all permitted users can view the logs.
| To create an index pattern, open the log analyzer. |
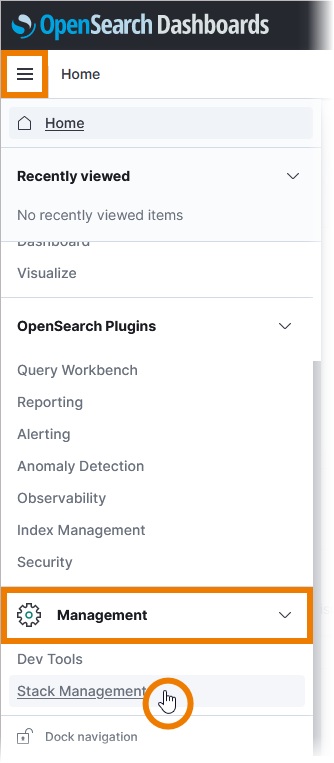
| Close the pop-up Select your tenant. Then open the menu |
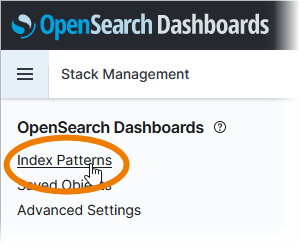
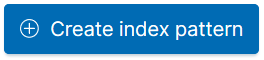
| In the Stack Management view, select menu option Index patterns. Click button Create index pattern:
|
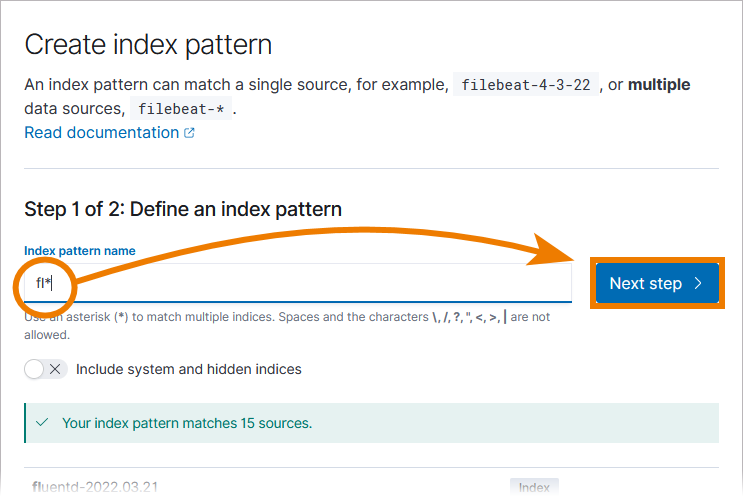
| PAS logs are stored by date in a rolling index called fluentd-<YYYY.MM.DD> e.g. fluentd-2022.01.25. |
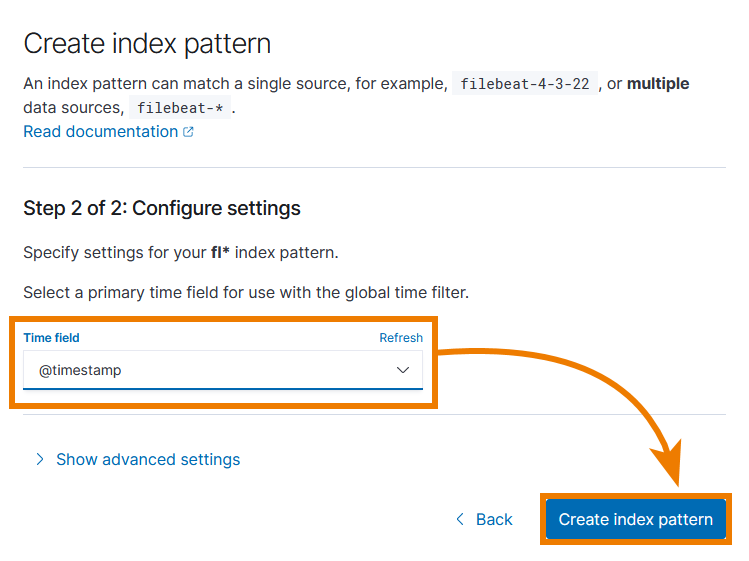
| In the next window, open the drop-down list of Time field and select @timestamp. Then click Create index pattern. |
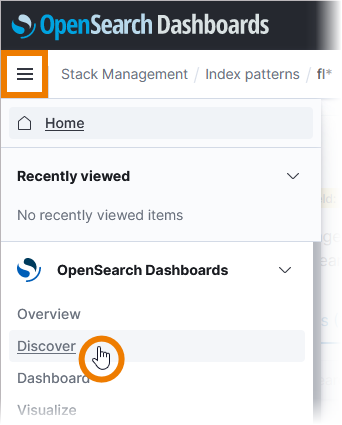
| Open the menu |
| You can now inspect the service logs. If no logs are displayed, extend the time range. Use the link Open Log Analyzer to inspect logs in the service details in Scheer PAS Administration to open the respective dataset within the Log Analyzer. |

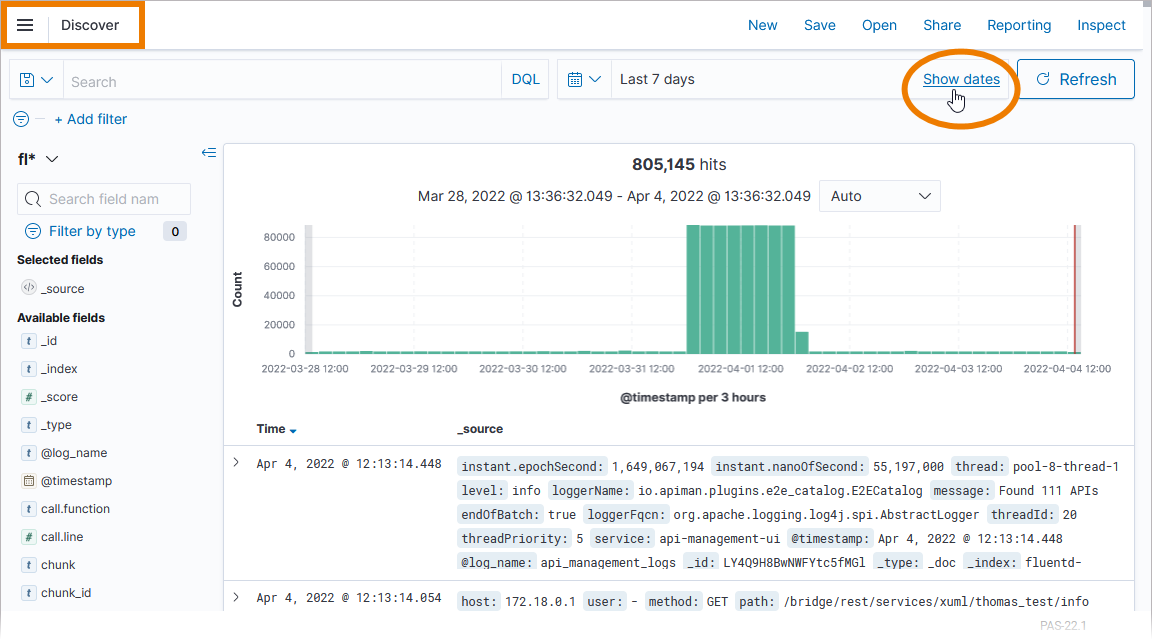
Discover: Searching Your Data
| To access the functionalities of the log analyzer, open the menu The Discover option allows you:
|
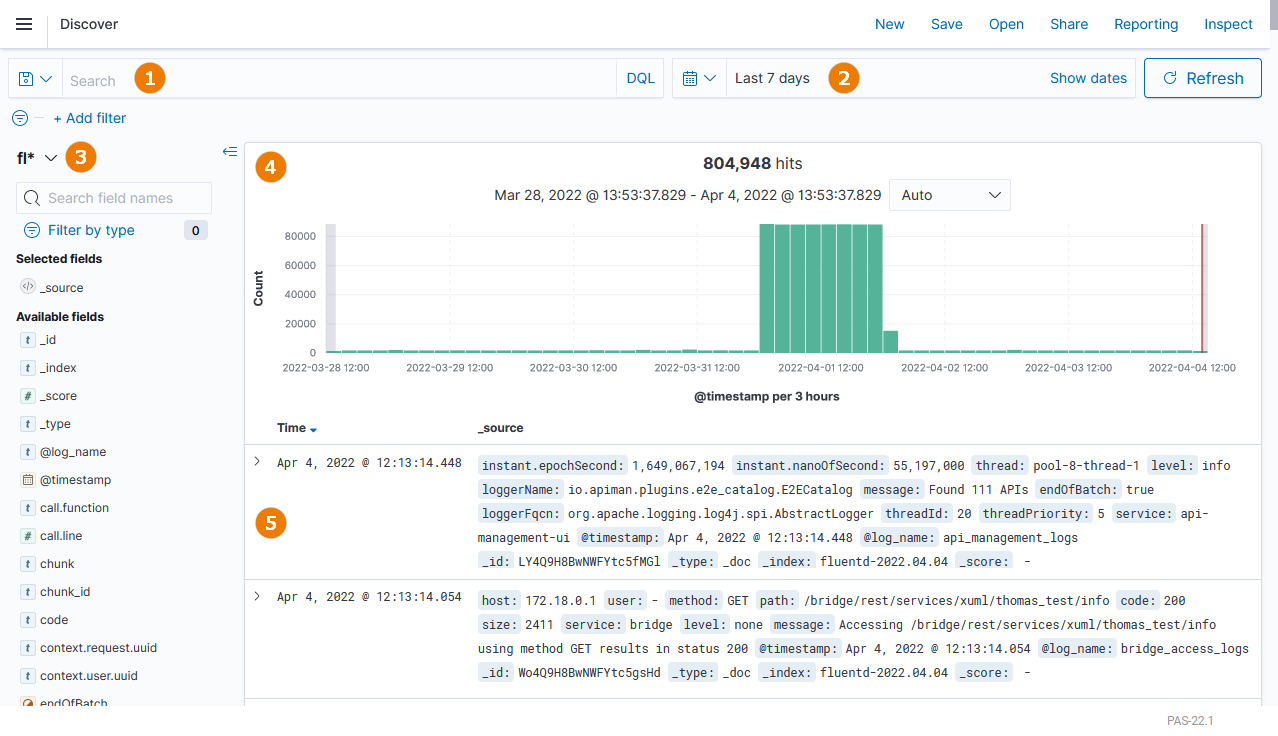
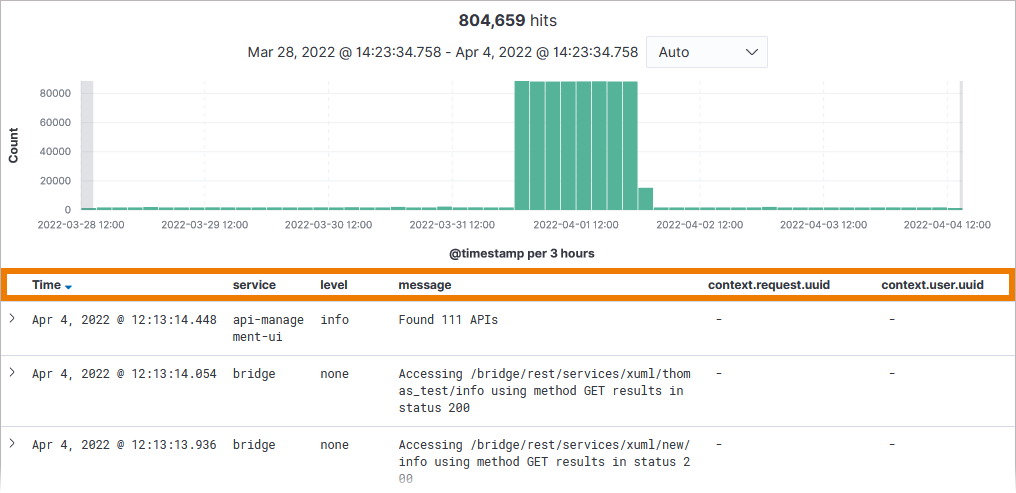
| Overview on the Discover page:
|
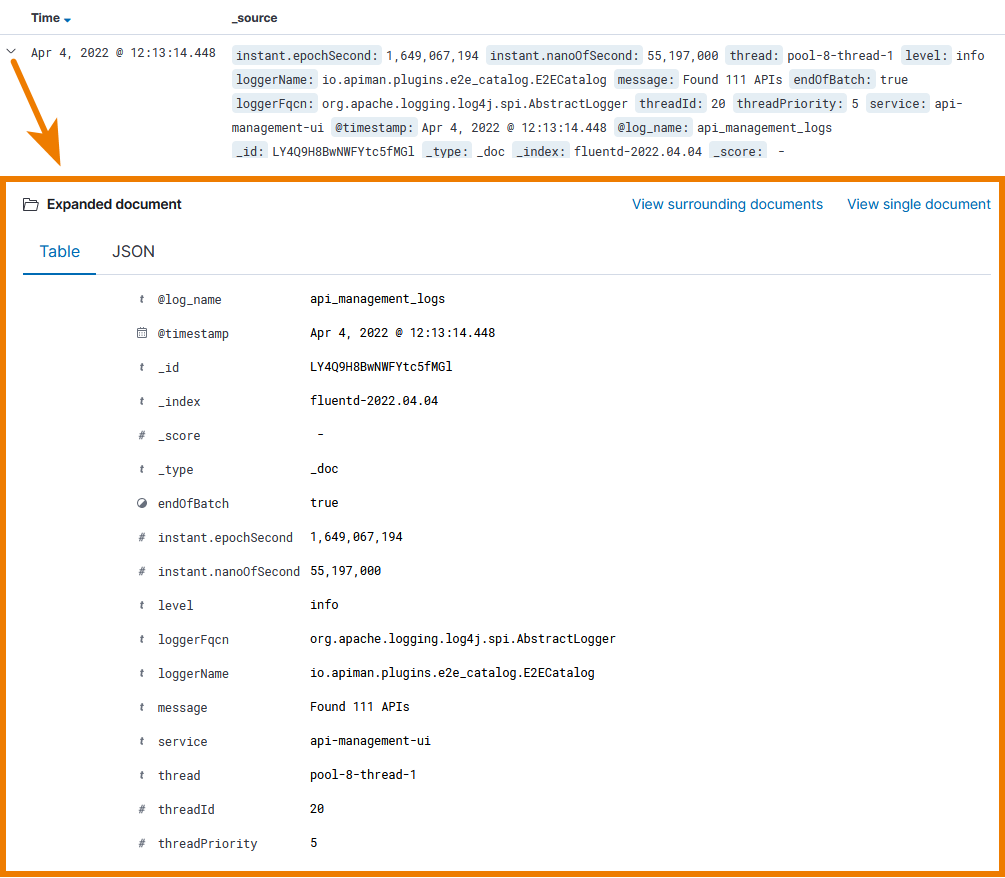
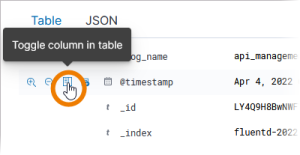
| Expand a document to show the available settings. To add a setting to the table display, click on its menu item |
| To inspect logs of Scheer PAS Node.js services, you can for example select the following settings to display:
Once you have created such a query, you are also able to save it for further use, for example in a dashboard. |
Creating Dashboards
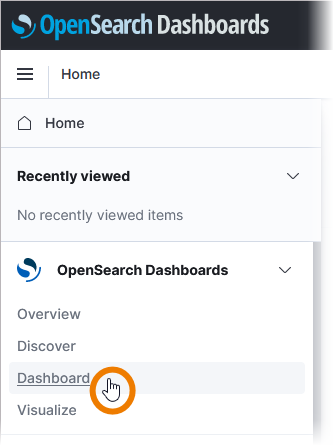
| The log analyzer also offers some default dashboards and the possibility to create your own dashboards. You can add a variety of different panels to inspect and visualize your data, for example area charts, bar and line charts, tree and heat maps, metrics, data tables and many more. Choose option Dashboard in the sidebar to start. |
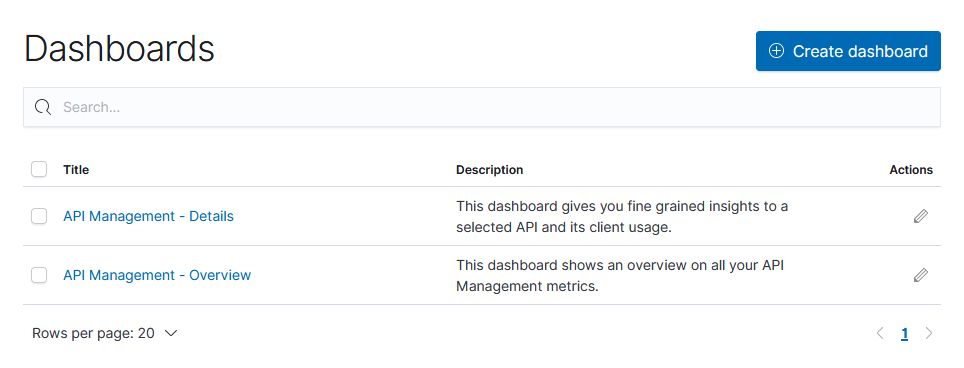
| The Scheer PAS Log Analyzer offers several default dashboards. If you open the Dashboard menu, the list of available dashboards is displayed. Refer to the API Management Guide for further information about the API Management default dashboards. If you want to add your own dashboards, use the Create dashboard button. Refer to chapter OpenSearch Dashboards in the Official OpenSearch Documentation for detailed information how to create a dashboard. |
On this Page:
Related Documentation:
Overview
Content Tools