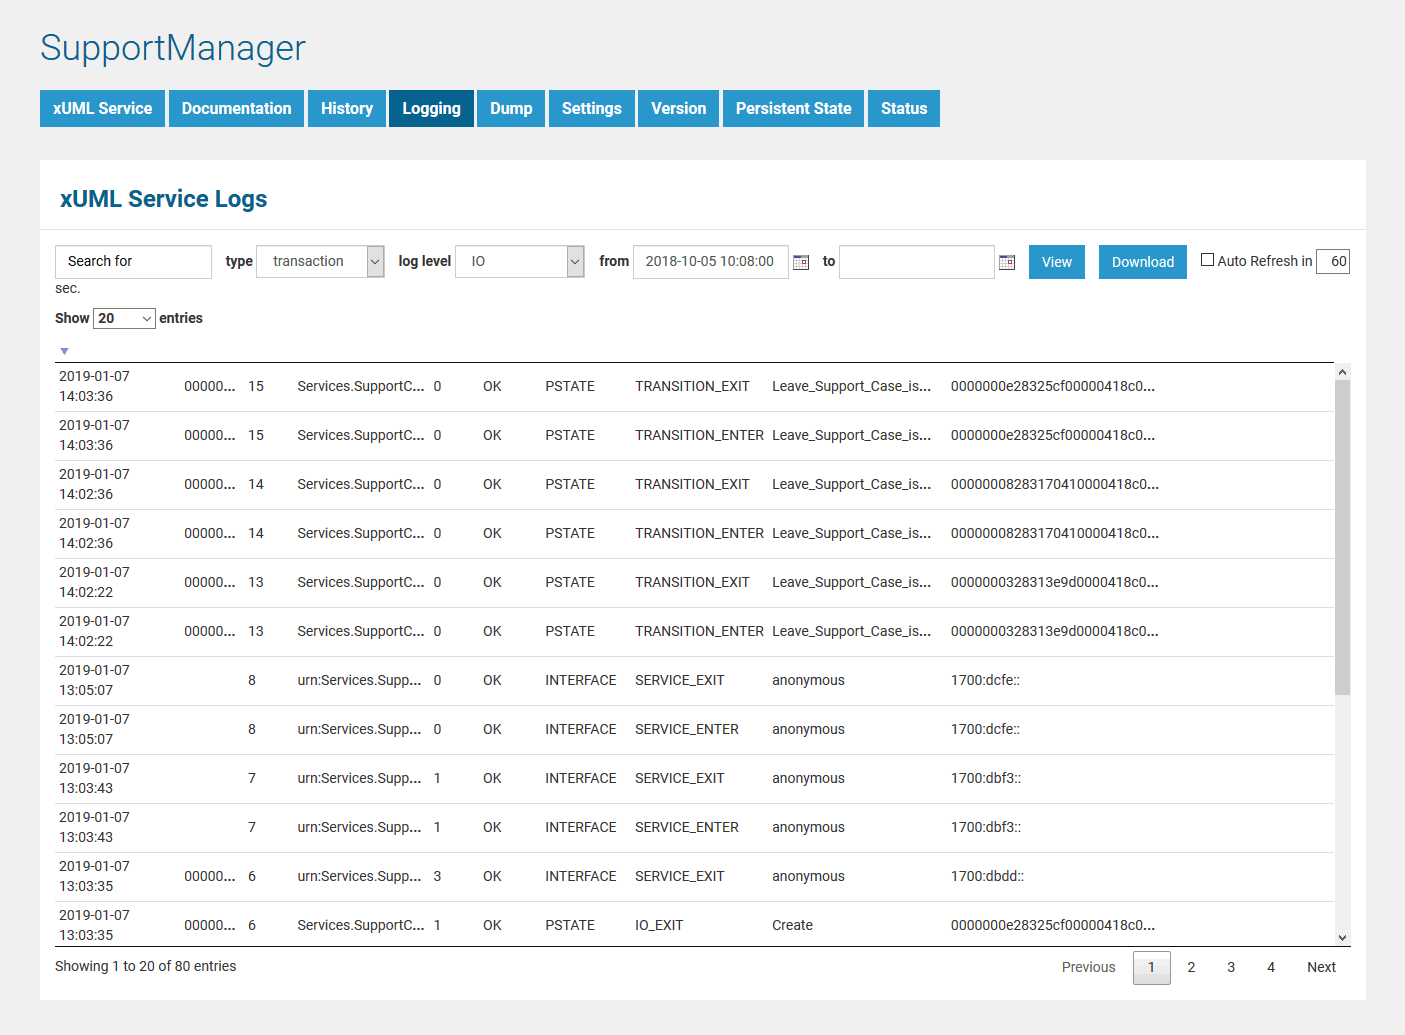
You can use the information that is logged to the transaction log for performance measurements or statistical evaluations (for instance, how often the transaction has been called, in which context, etc.). There is one log file per day or one per hour – depending on what has been configured in the transaction log rotation interval of the service preferences (see Preferences of an xUML Service). The amount of data that is logged depends on the selected transaction log level (see Transaction Log Levels).

How to search the logfiles is explained in detail on Logging of xUML Services.
Usually, you will not analyze the transaction log within the Bridge, but download the log file. Then you can have a look at it either in Excel ...

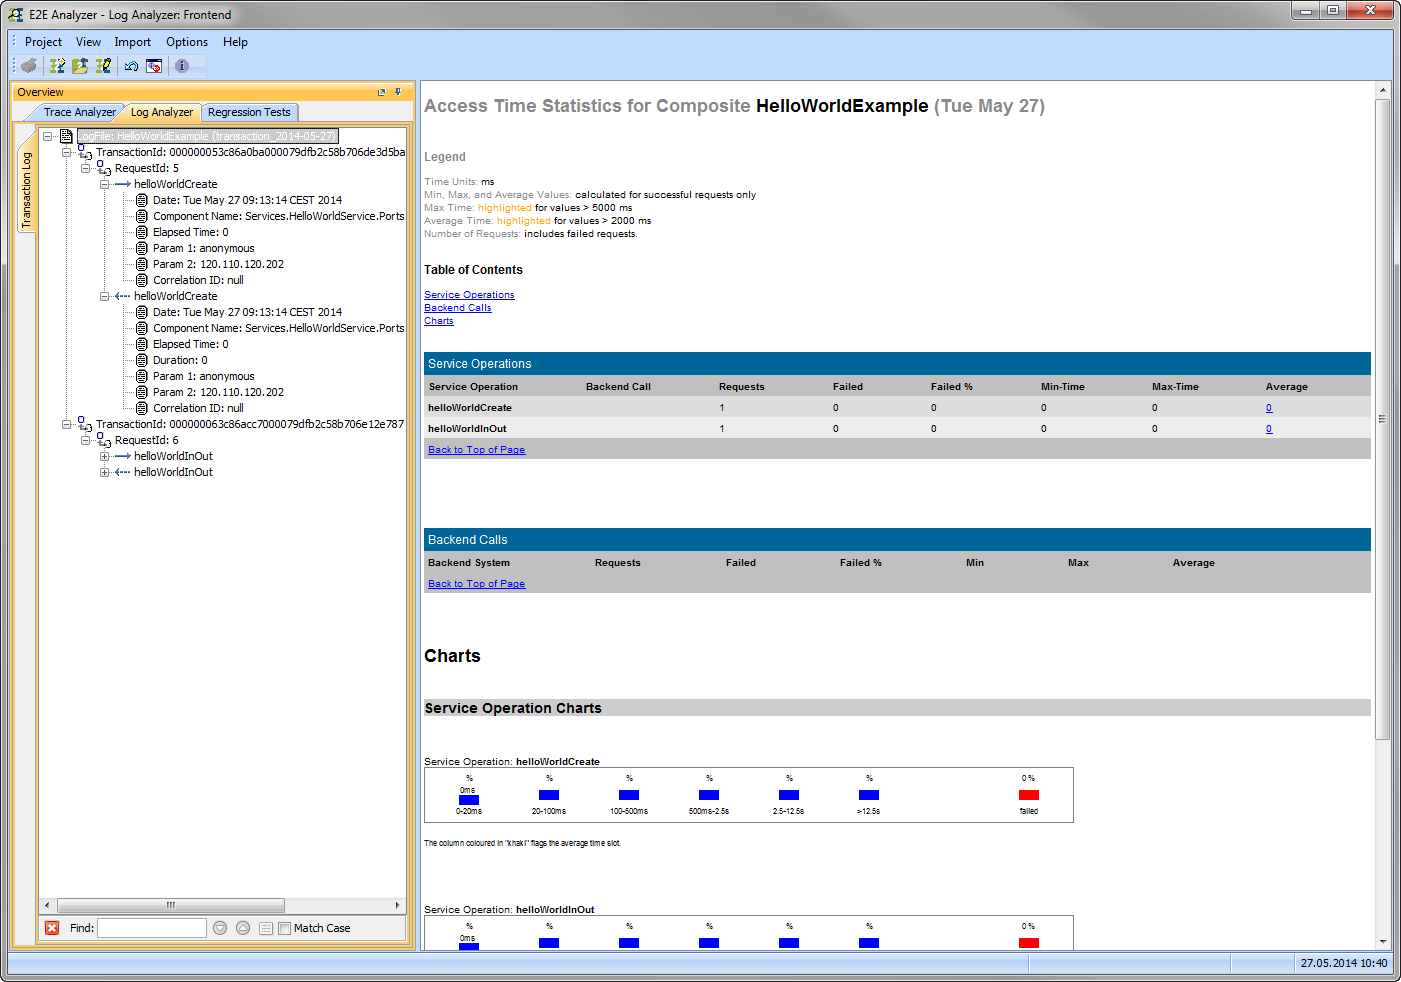
... or analyze it with the Analyzer.

Transaction ID
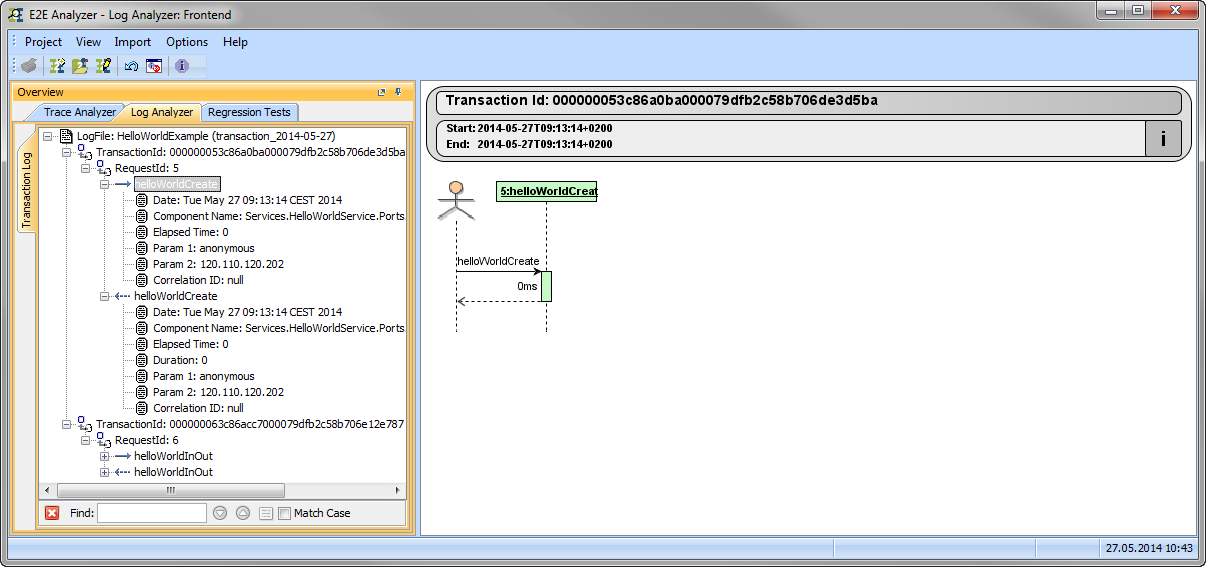
In the Analyzer, the transaction log will be sorted by transaction ID. You can expand the tree of a transaction ID to inspect the sequence diagram of this transaction in the panel on the right.

While modeling services with MagicDraw and Builder, you have access to the received transaction ID (getTransactionID) and you can pass it on in your service model.