These documentation pages refer to the E2E Dashboards version 1. This version is not supported anymore - please refer to the documentation of the new Analytics Dashboard instead. |
Operations is asked, if business processes are slowing down or running on error. They'll have to sort out the reason for that. Is it a technical problem? Are the business processes poorly designed? And so forth.
The goal for developing the Dashboards was to give Operations the ability to pinpoint the systems that are causing troubles.They should have the means to
- analyze the system without having to know all dependencies between the services.
- find events that did not happen (e.g. product was not delivered).
- apply top-down or bottom-up analysis to find suspects.
- get a warning if something is developing wrongly and have the possibility to intervene.
For example, they should find a diagram like this:
Figure: Service Dashboard Showing a Significant Change of System Performance

The Service and the Process Dashboards provide the means for Operations to dig into problems and to find the possible cause.
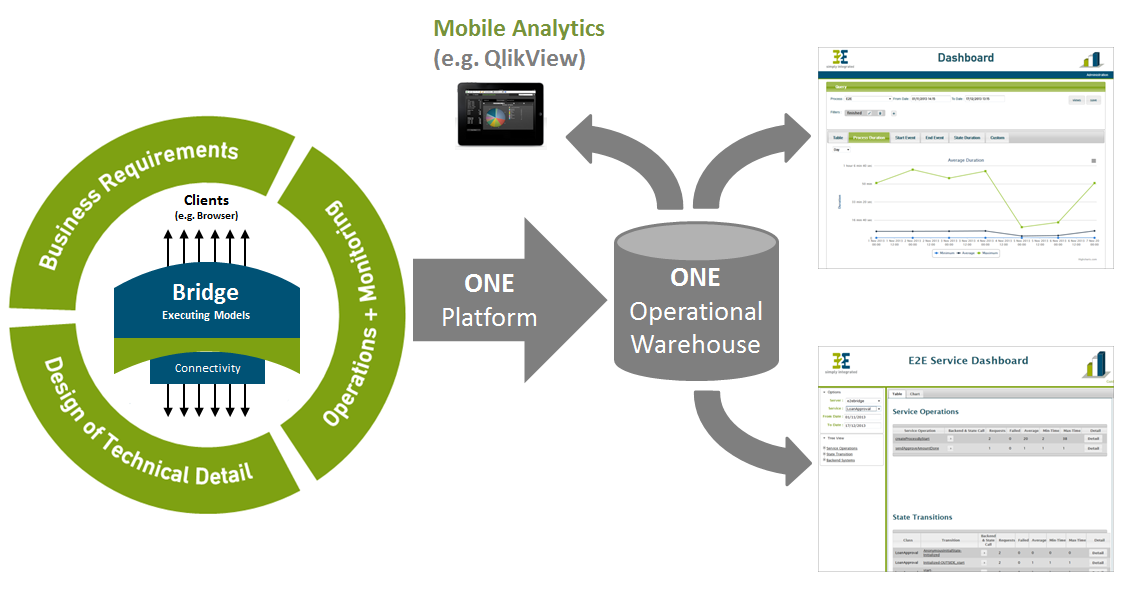
Figure: Operational Intelligence Platform - Overview

Technical and business process data of services running on the Bridge are stored in an operational data warehouse. This data warehouse in combination with the dashboards is bridging the gap Operations experiences when they want to analyze problems.