On this Page:
If such an error event occurs, the E2E Bridge calls the registered monitoring service, that executes whatever has to be done in this case, for instance sending an email to the system administrator. The monitoring service is also a UML model being executed.
Example File (Builder project Basic Modeling/ErrorHandling):
| <your example path>\Basic Modeling\ErrorHandling\uml\monitoring.xml |
Monitoring Service
The monitoring service is just another Bridge service that is registered as a monitor to the E2E Bridge. If any service on the Bridge has an error (level Fatal or Error) or even is terminating unexpectedly, the Bridge calls the registered monitoring service. In this service, you are free to model anything you want, all Bridge features are available. The only requirement is that the service provides a specific frontend SOAP interface, corresponding to the Bridge calls.
There is also a standard implementation of a monitoring service available. For more information on features and handling, see Monitoring Service With UI.
Requirements of a Monitoring Service
A service designed to be registered to an E2E Bridge must meet the interface definitions of the following WSDL:
<wsdl:definitions xmlns:wsdl="http://schemas.xmlsoap.org/wsdl/" xmlns:tns="urn:MonitoringService"
                  xmlns:http="http://schemas.xmlsoap.org/soap/http"
                  xmlns:xs="http://www.w3.org/2001/XMLSchema"
                  xmlns:soap="http://schemas.xmlsoap.org/wsdl/soap/"
                  xmlns:soapenc="http://schemas.xmlsoap.org/soap/encoding/"
                  name="MonitoringService"
                  targetNamespace="urn:MonitoringService">
   <wsdl:types/>
   <wsdl:message name="MonitoringPort_monitor_Request">
      <wsdl:part name="timestamp" type="xs:dateTime"/>
      <wsdl:part name="host" type="xs:string"/>
      <wsdl:part name="service" type="xs:string"/>
      <wsdl:part name="processID" type="xs:string"/>
      <wsdl:part name="level" type="xs:string"/>
      <wsdl:part name="category" type="xs:string"/>
      <wsdl:part name="type" type="xs:string"/>
      <wsdl:part name="code" type="xs:string"/>
      <wsdl:part name="description" type="xs:string"/>
      <wsdl:part name="detailLocation" type="xs:string"/>
   </wsdl:message>
   <wsdl:message name="MonitoringPort_monitor_Response"/>
   <wsdl:portType name="MonitoringPort">
      <wsdl:documentation>Example to test log operations.</wsdl:documentation>
      <wsdl:operation name="monitor">
         <wsdl:input message="tns:MonitoringPort_monitor_Request"/>
         <wsdl:output message="tns:MonitoringPort_monitor_Response"/>
      </wsdl:operation>
   </wsdl:portType>
   <wsdl:binding name="MonitoringPort_SOAPBinding" type="tns:MonitoringPort">
      <soap:binding style="rpc" transport="http://schemas.xmlsoap.org/soap/http"/>
      <wsdl:operation name="monitor">
         <soap:operation soapAction=""/>
         <wsdl:input>
            <soap:body encodingStyle="http://schemas.xmlsoap.org/soap/encoding/"
                       namespace="urn:Services.MonitoringService.MonitoringPortType.MonitoringPort"
                       use="encoded"/>
         </wsdl:input>
         <wsdl:output>
            <soap:body encodingStyle="http://schemas.xmlsoap.org/soap/encoding/"
                       namespace="urn:Services.MonitoringService.MonitoringPortType.MonitoringPort"
                       use="encoded"/>
         </wsdl:output>
      </wsdl:operation>
   </wsdl:binding>
   <wsdl:service name="MonitoringService">
      <wsdl:port binding="tns:MonitoringPort_SOAPBinding" name="MonitoringPort">
         <soap:address location="http://${wsdl_host_urn:Component_View.Composites.MonitoringExample.MonitoringService}:13037/MonitoringService/MonitoringPort"/>
      </wsdl:port>
   </wsdl:service>
</wsdl:definitions>
This means that the service must have an operation called monitor with the following input parameters:
| Input Parameter | Type | Direction | Description | Values | Example |
|---|---|---|---|---|---|
| timestamp | DateTime | in | Receives the timestamp of the incident (UTC-Time). | 2018-01-19T05:21:22Z | |
| host | String | in | Receives the name of the node instance where incident occurred. | e2ebridge.e2e.ch | |
| service | String | in | Receives the composite name of the service that has failed. | SAP_Interface | |
| processID | String | in | Receives the process ID the service has been assigned by the operation system. | 30136 | |
| level | String | in | Receives the error level. | Should be one of:
| Error |
| category | String | in | Receives the category of the error. | Should be one of:
| User |
| type | String | in | Receives the error domain. | A user defined or a standard error domain. For more information, refer to Modeling Error Handling. | SAP |
| code | String | in | Receives the error code of the error. Together with the domain value, this is the unique identifier of an error. | A list of all built-in error domains/codes can be found on Error Codes pp. | 4711 |
| description | String | in | Receives the description of the error. | Human readable, see also Modeling Error Handling. | File not found. |
| detailLocation | String | in | Receives the location of a log file that might have further information about the incident. |
Registering the Monitoring Service
After you have deployed the monitoring service to the Bridge, you need to register it to the Bridge at the node preferences page. For that purpose, you have to define the SOAP URL of the monitoring service. The SOAP URL of the monitoring service can be taken from the element soap:address location of the WSDL of the monitoring service (usually it is http://<hostname>:<port>/<package name(s)>/<E2ESOAPPortType>).
Figure: Registering the Monitoring Service
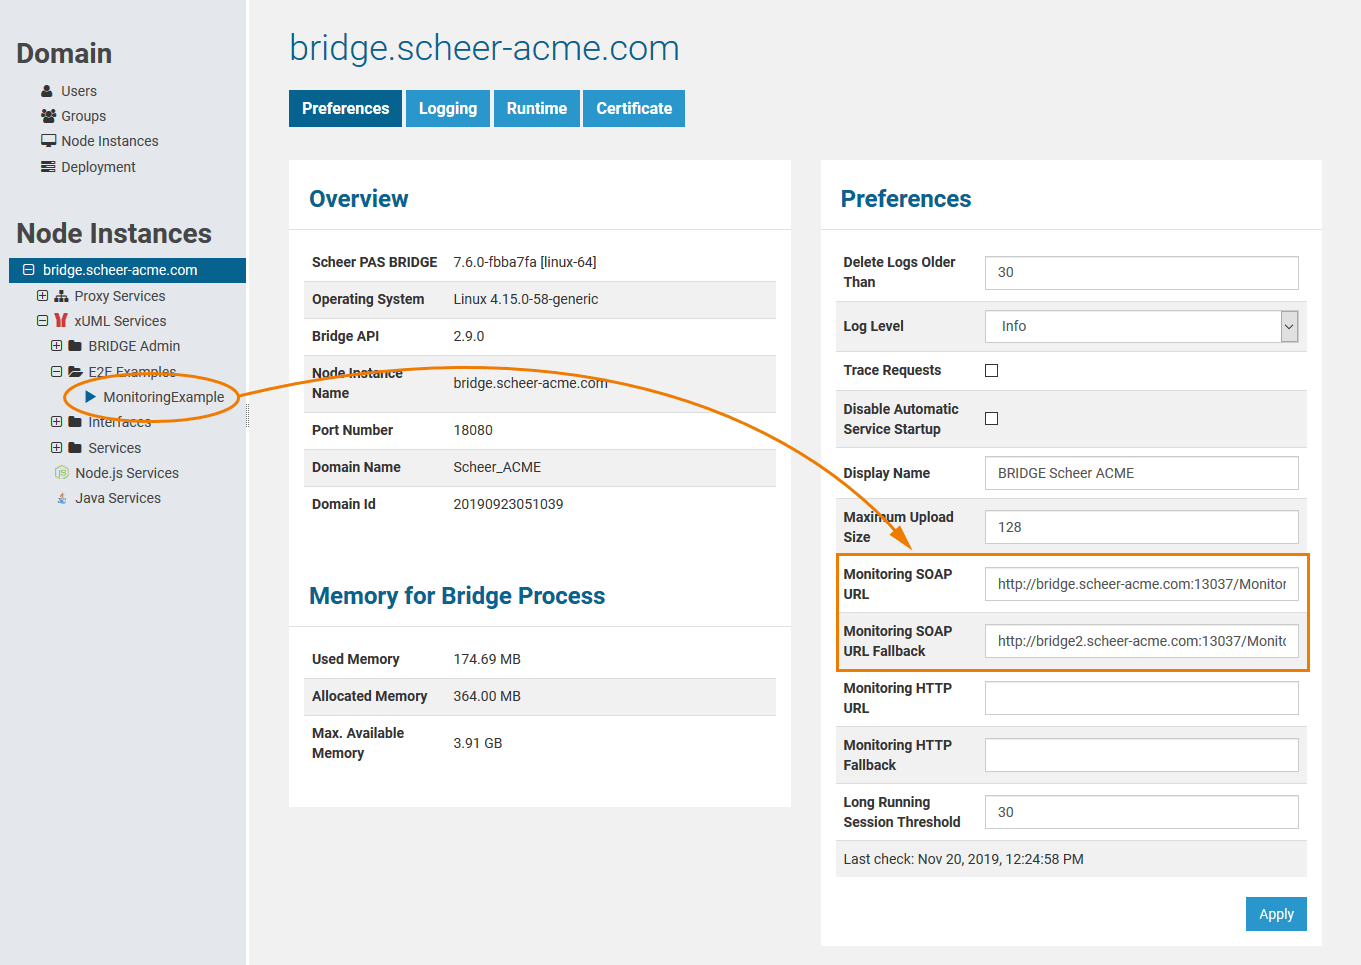
Actually, it is even possible that the monitoring service fails. Thus, a fallback monitoring service can optionally be specified in field Monitoring SOAP URL Fallback. This fallback service can even run on another Bridge.
- If you register no monitoring service then nothing happens.
- If you register one monitoring service then this service is called.
- If you register two monitoring services then the first service is called. If the call fails, means the monitor throws an exception by itself or does not respond within three seconds, then the second service is called.
Overview
Content Tools