Page History
The Process Analyzer is an active dialog window in which process analyses are created and managed. When If you open Process Mining is opened for the first time, the Process Analyzer is initially empty:
![]()
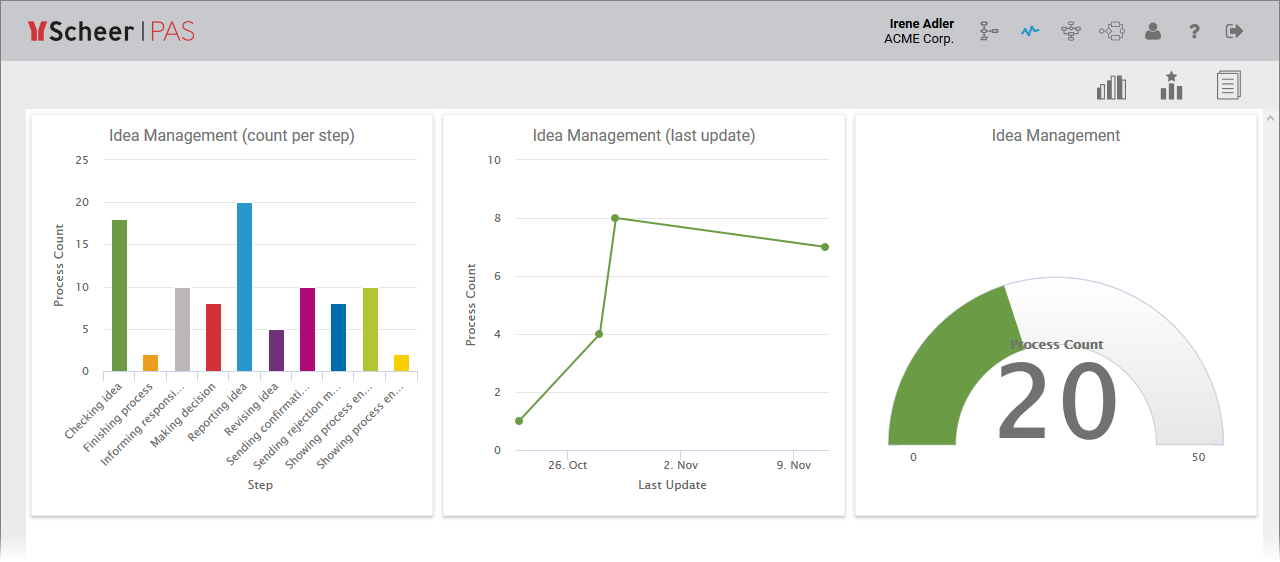
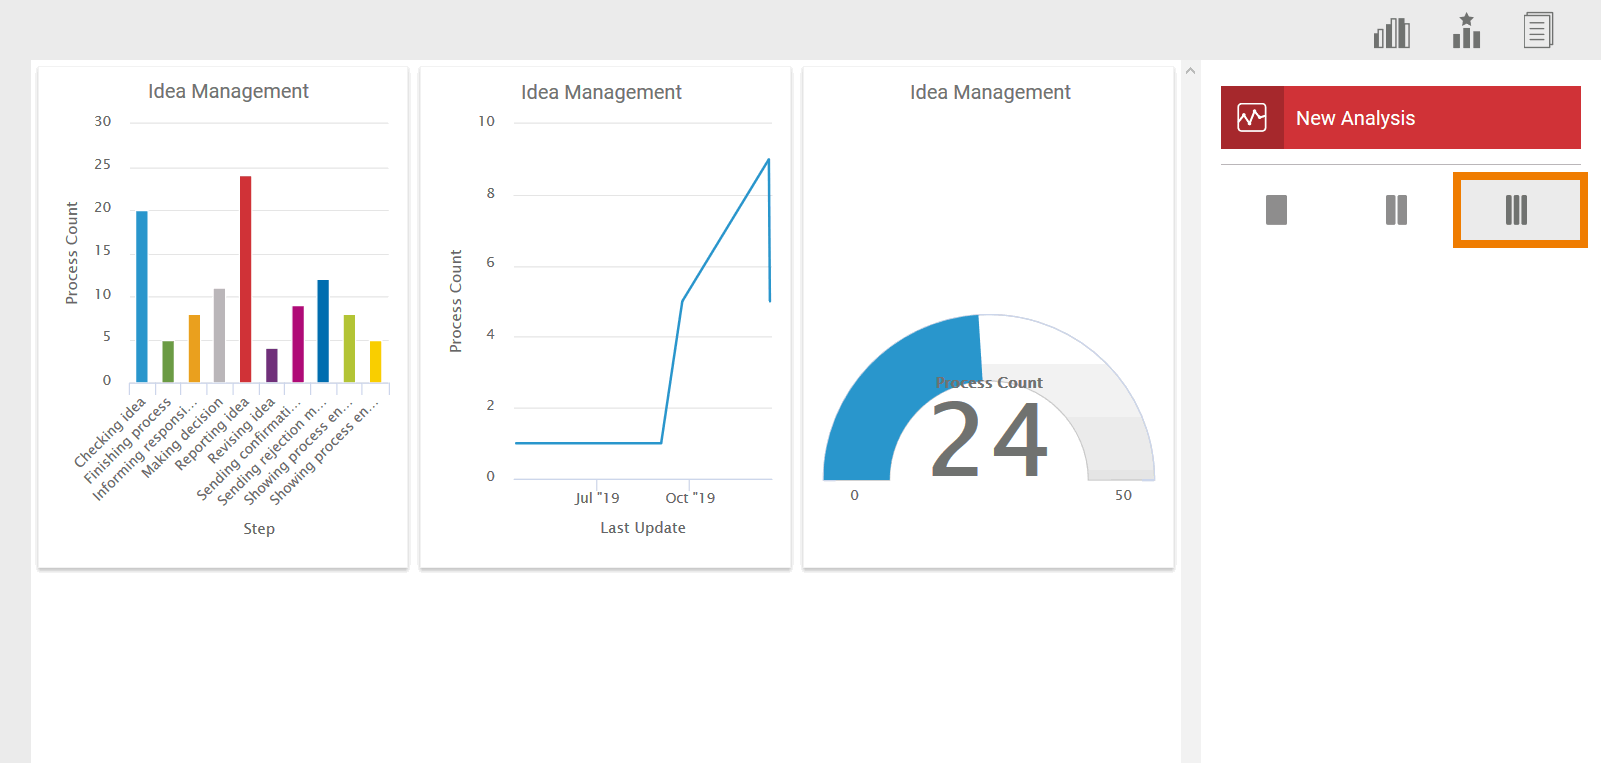
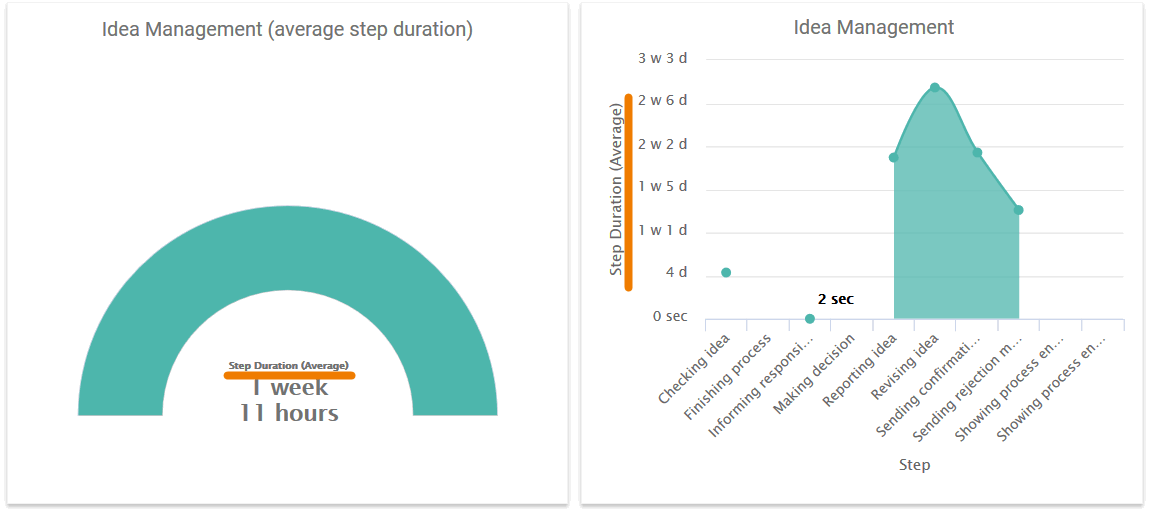
As soon as analyses have been created, the corresponding charts are displayed in the Process Analyzer:
| Multiexcerpt include | ||||||
|---|---|---|---|---|---|---|
|
Managing Your Analyses
The You can customize the presentation of the charts can be customized according to your own wishes and requirements:
- Choose between a one, two and three column view.
- Add headings to your analyses.
- Change the position of analyses you have created via a simple move function.
- Reload new instances at the click of a buttonwith one click.
- Show captions for small, or all data points in the analysis.
This function is not available for tachometer, pie charts and network charts. - Delete analyses that no longer required from the Process Analyzer.
- Enable individual instances of an analysis to be listed.
- Use an already analysis already created as a template.
Selecting the Number of Columns
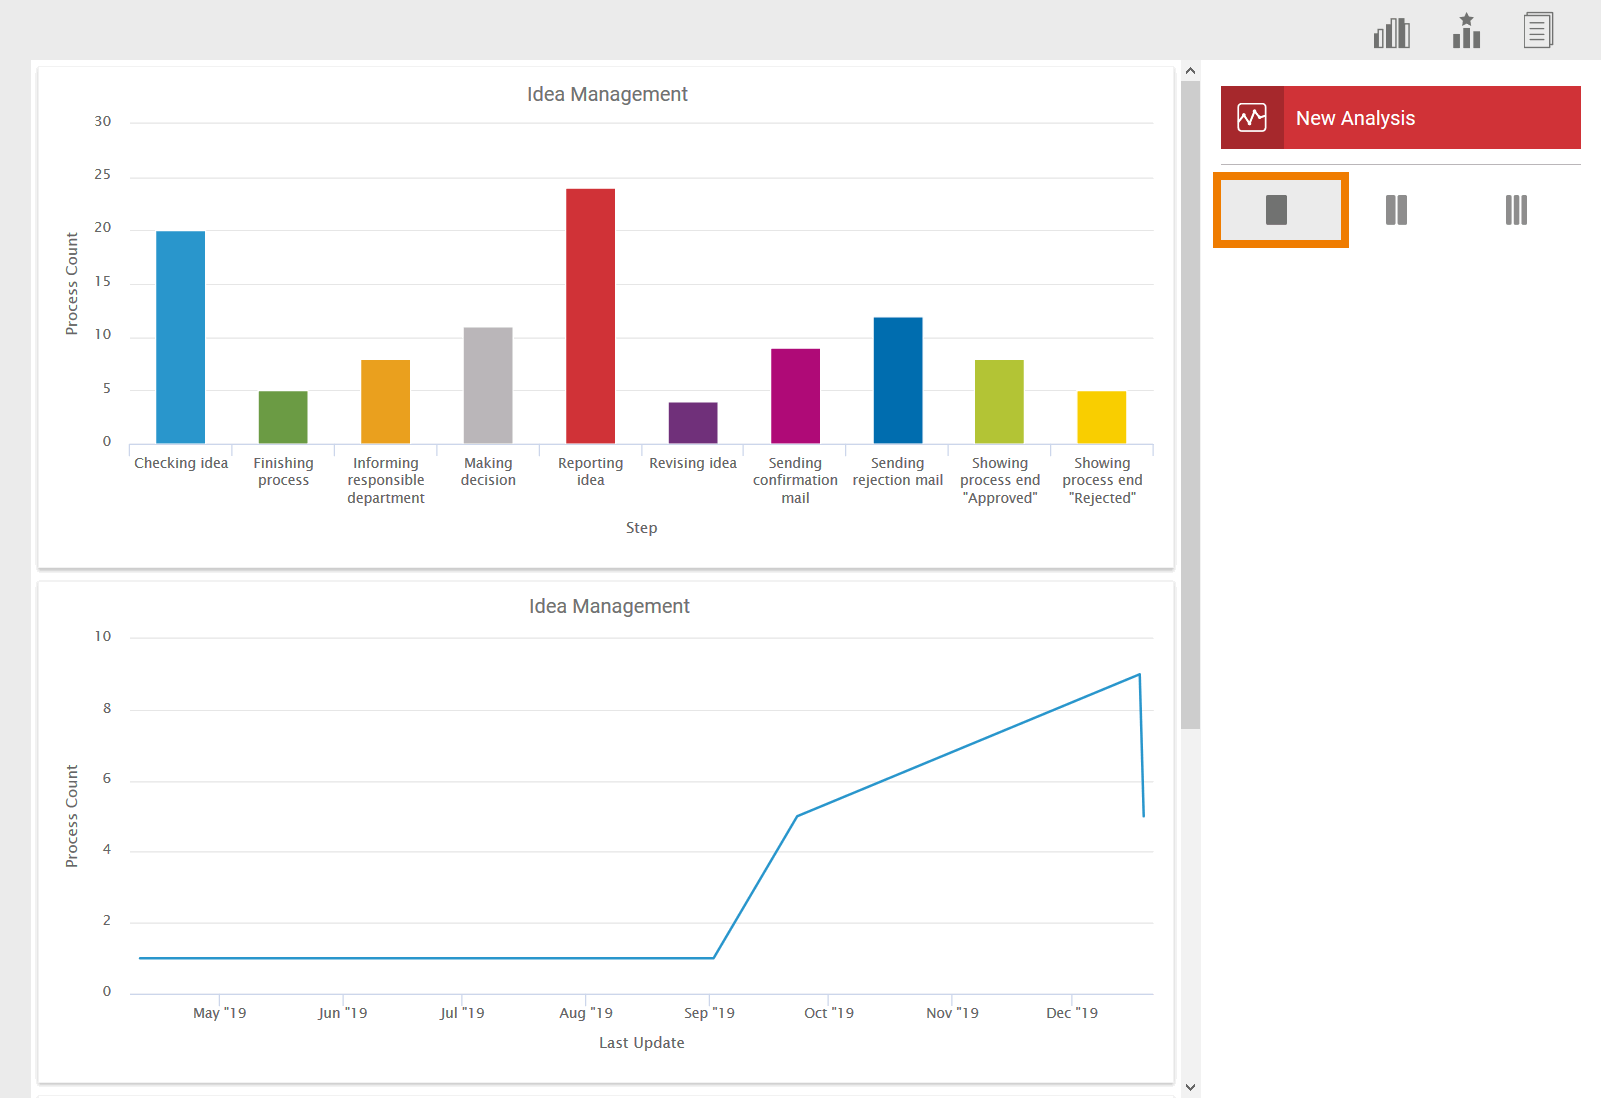
The You can adjust the column layout of the Process Analyzer can be divided in up to three columns.
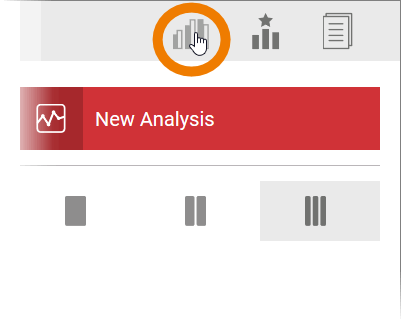
| Open the Analysis Sidebar to amend the layout. There are three buttons Use one of the three options in the sidebar with which the number of columns can be selected. |
| Use the button option |
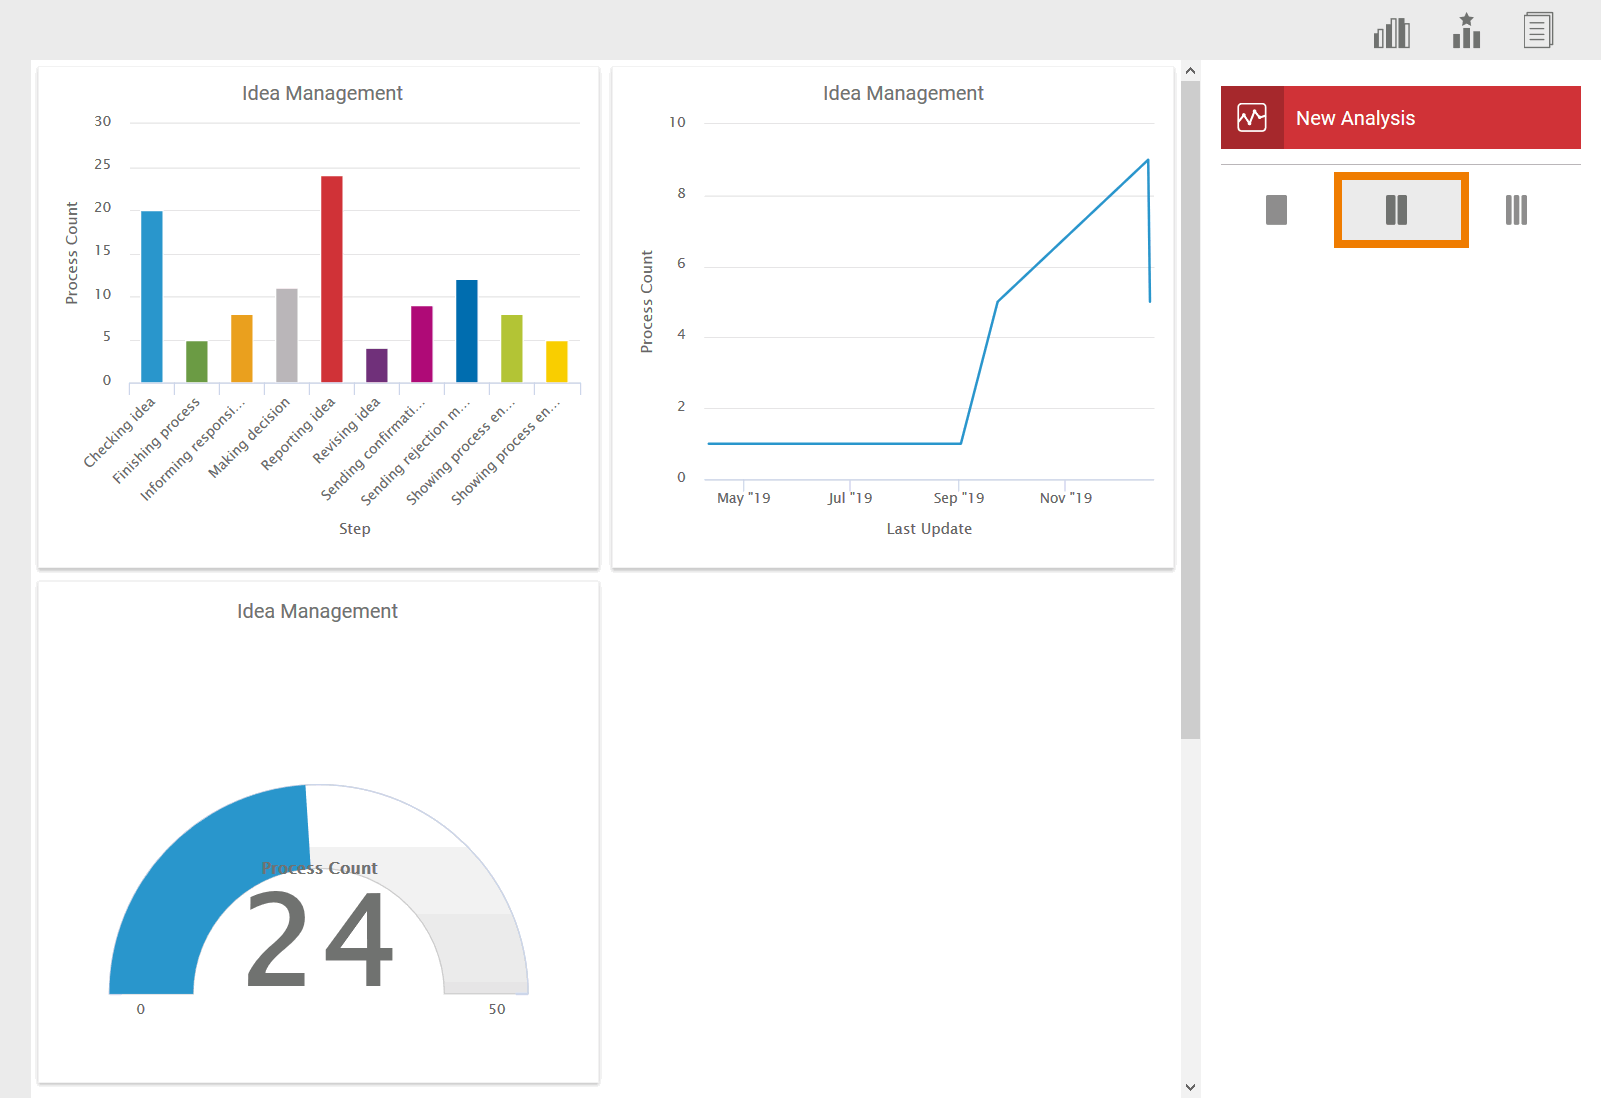
| For Use option |
| Use the button |
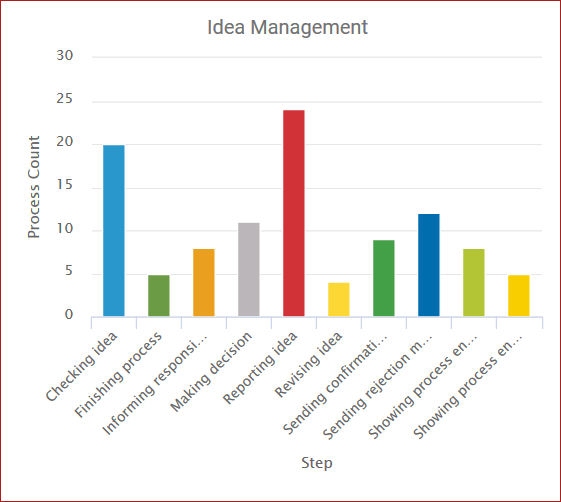
Changing the Title of an Analysis
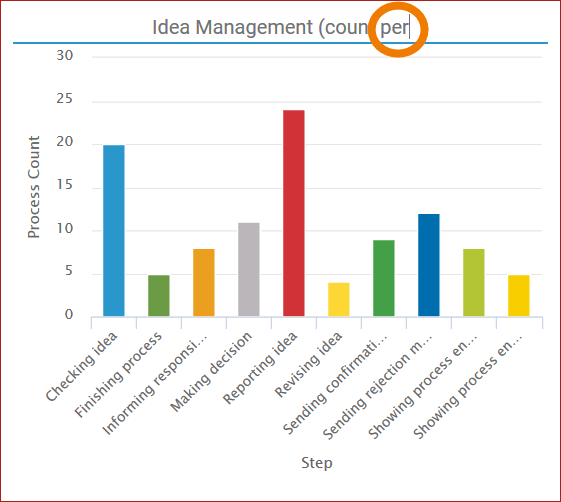
| When creating a new analysis, the process name is displayed automatically as as title. You You can change the title of the analysis at any time. |
| Change the title of the analysis by clicking Clicking on the title bar. A A blue line and a cursor appear. You You can now edit the text of the analysis header. The title of an analysis can also be edited via the Analyses Sidebar. |
Changing the Analysis Display Colors
| The colors within a chart are assigned automatically when an analysis is created. |
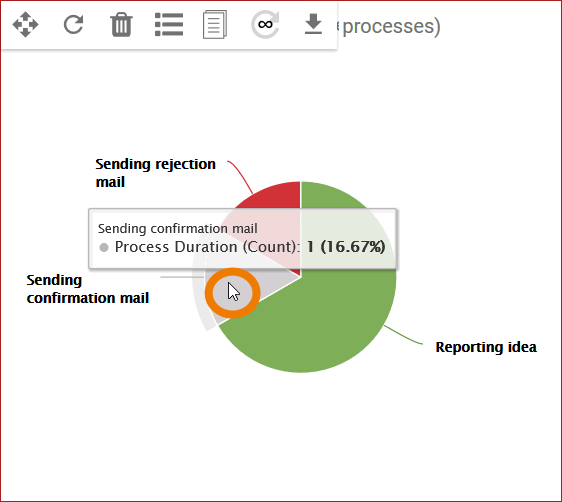
| The colors assigned to individual elements can be changed as required. You can change the assigned colors: Double-click the element whose color you wish to change. |
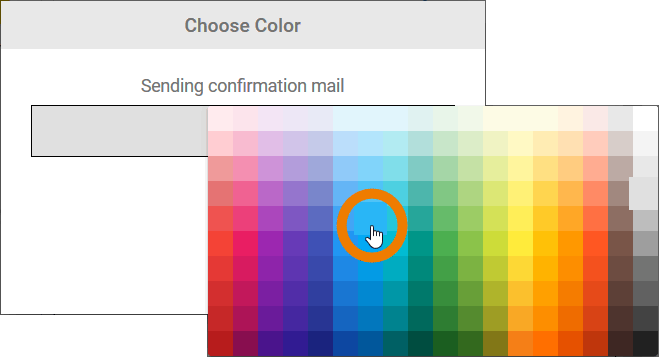
| An editor will open. Click on the current color to open the color selection. Click on Select the color you want to apply. |
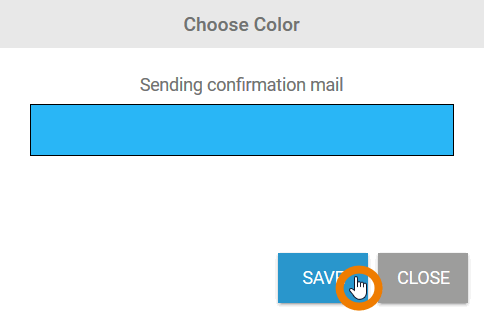
| The selected color selected is applied. Confirm the change by clicking on Savedisplayed. Click Save to apply your change. |
| The element is shown in the new color. |
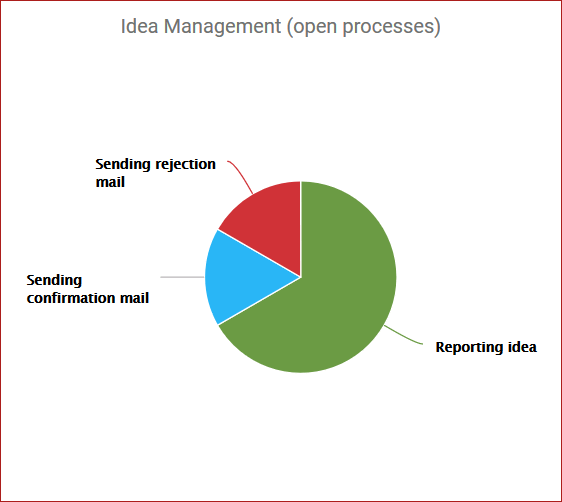
To ensure that analyses can be compared, the same color is always used for the same key figure in the same aggregation:
| Note |
|---|
When Please note that changing colors , please note that this can affect can have an effect on other analyses. |
Detail Display and Zoom
The charts managed in the Process Analyzer are interactive and offer a number of additional functions.
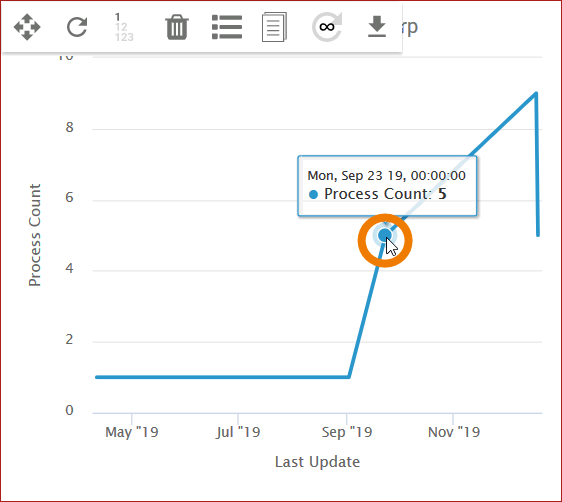
| Showing Details Move the mouse cursor over the chart content to display individual key figures. |
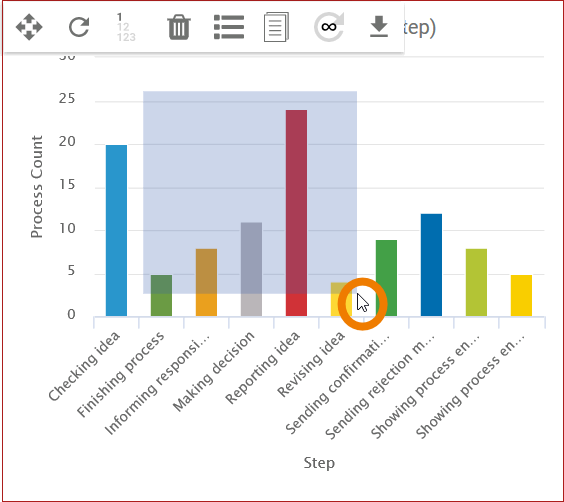
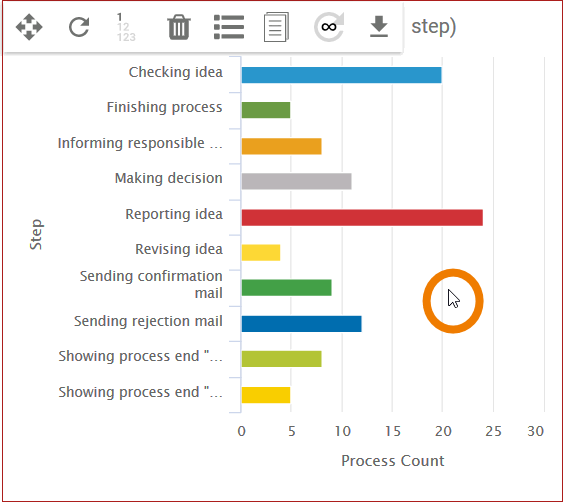
| Enlarging Sections A zoom function is available within a chart is available. Use the mouse to create a selection rectangle in order to enlarge a section. |
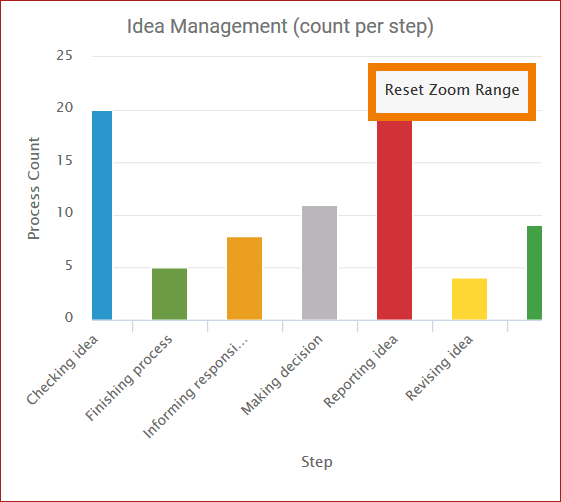
| The content of the chart is enlarged and the scale of the axes adjusted accordingly. In In addition, the option Reset Zoom Range button appears, which can then be used to restore the appears: Use this option to restore the chart to its original sizeoriginal size. |
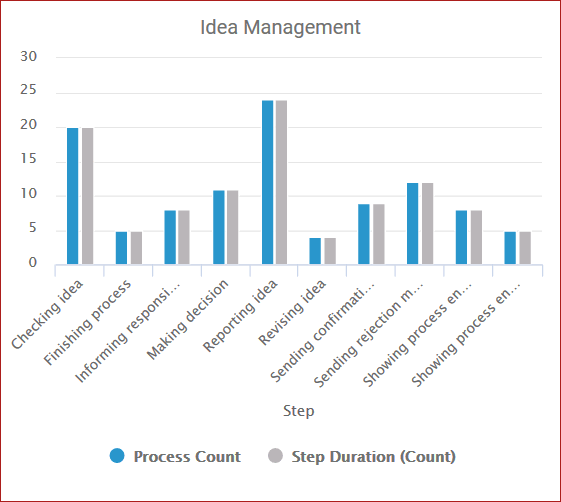
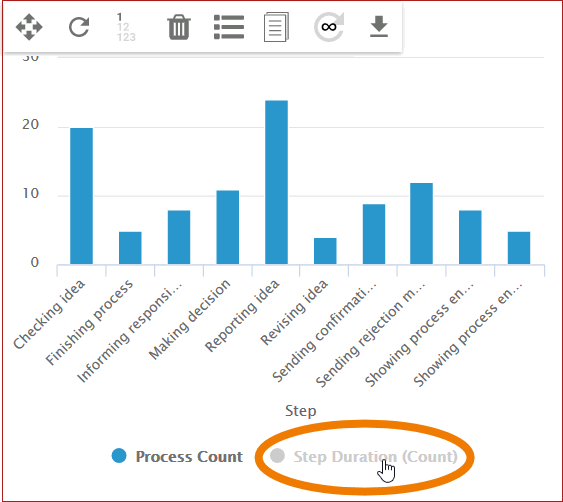
Showing and Hiding Units
If more than one item is shown on one of the two axes, these can be hidden and revealed as desired. With a mouse click in the chart key, the parameter selected in the chart is either removed or added back in.
Process count and step duration are shown: | Step duration is hidden: |
|
|
The Analysis Menu
The view of an analysis created is managed via the analysis menu. The analysis The currently active analysis is identified indicated by the a colored borderframe.
| Click on an analysis to activate it. The The chart is marked with a colored border:frame. |
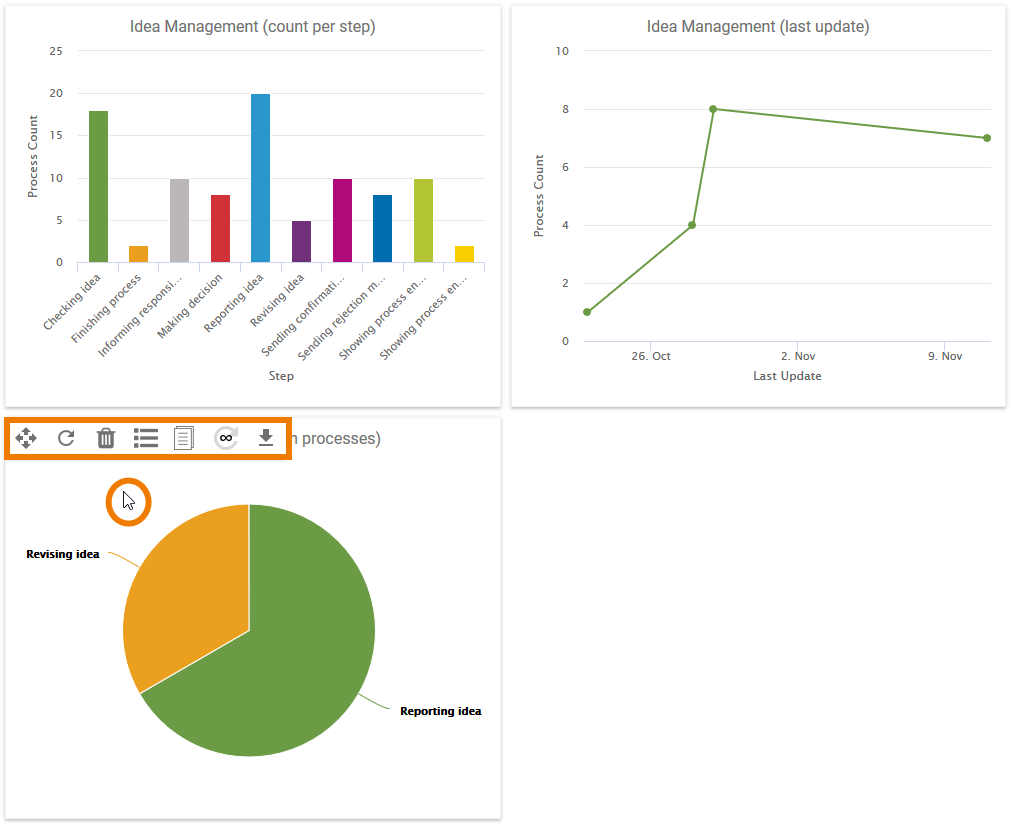
| The analysis menu is shown when the mouse cursor is moved you hover over an analysis:. |
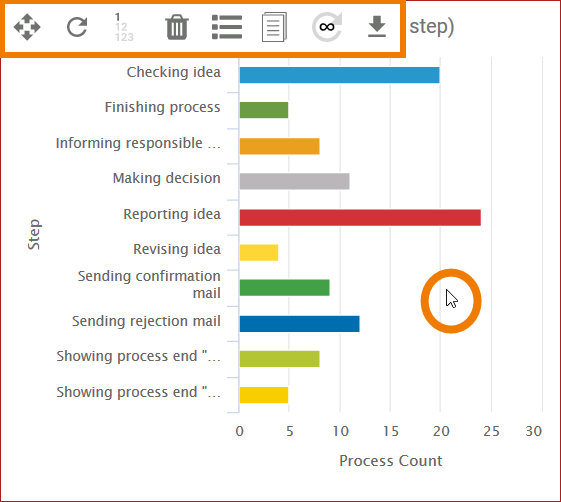
The following functions can be used via the buttons in the menu:
| Icon | Function | ||
|---|---|---|---|
| Positioning Analyses | |||
| Reloading an Analysis | |||
| Displaying Data Labels | |||
| Deleting an Analysis | |||
| Displaying the Instance List | |||
| Creating a Template | |||
| Setting Automatic Reloading | |||
| Saving Analysis as PNG | |||
Displaying the Process Diagram
|
Positioning Analyses
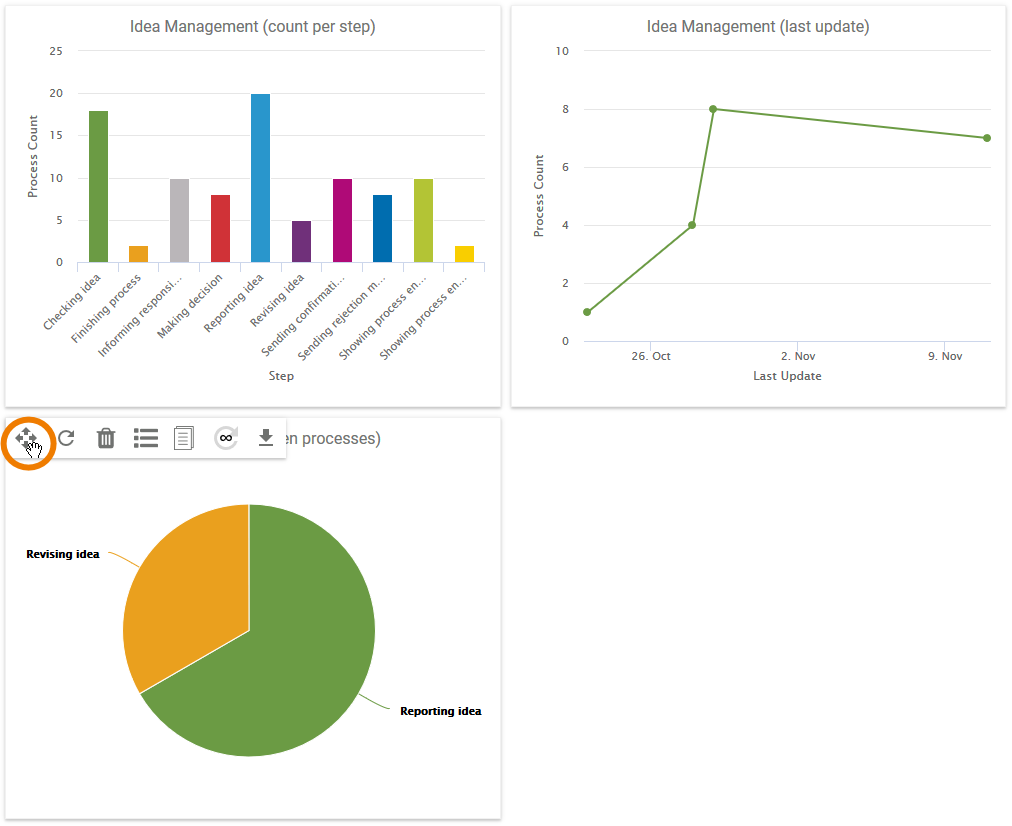
If multiple several analyses have been created, these can be positioned freely. Use the button you can change their order in the Process Analyzer. Use option to move and re-position the analysis.
| Move the mouse cursor over the analysis to display the menu. |
| Select the button option |
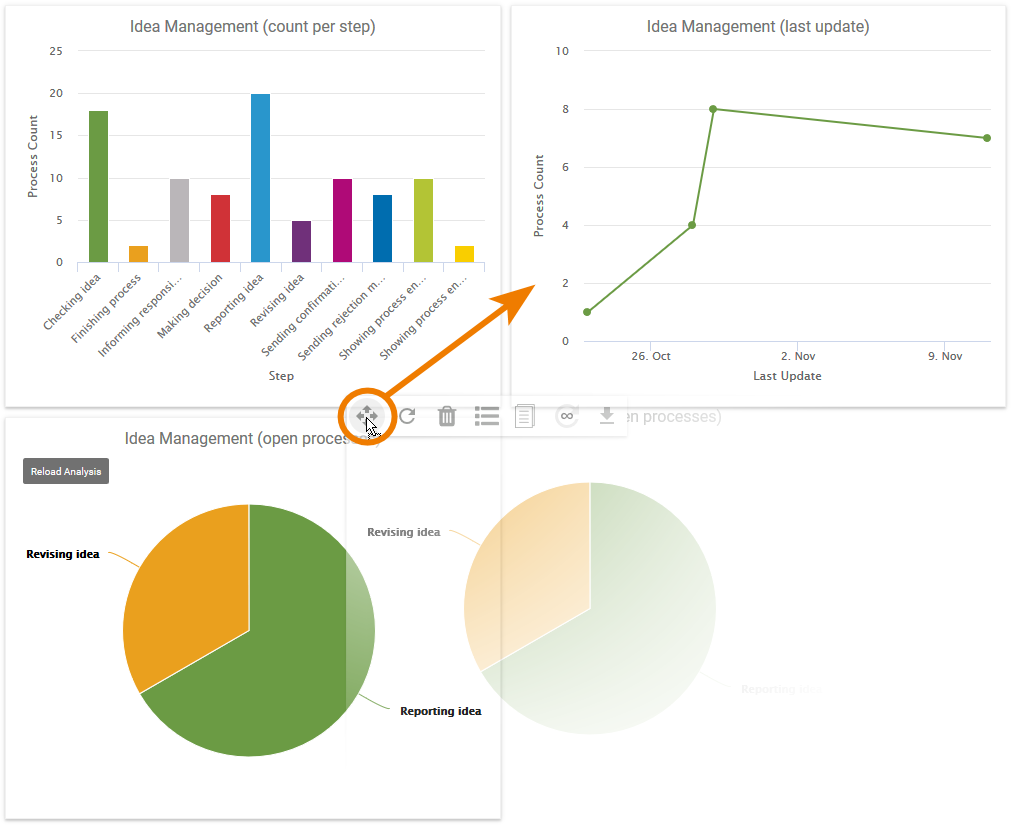
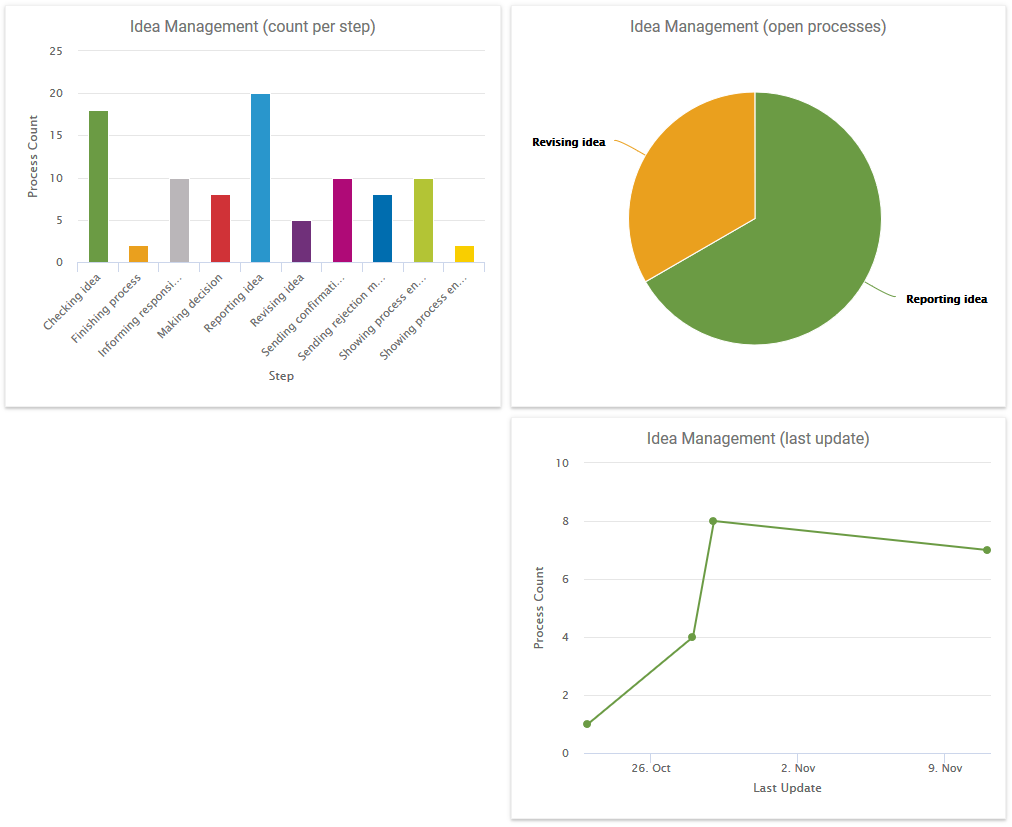
| Drag the analysis to the desired position. |
| The chart is placed in the new position. The position of the other charts is adjusted accordingly. |
Reloading an Analysis
Click the button Use option Reload analysis to reload refresh the instance data of the underlying process. This This is helpful if Process Mining has been open for a while and the user wants to account for new instance data that has since been generated in the analysis.
| Multiexcerpt include | ||||||
|---|---|---|---|---|---|---|
|
| Multiexcerpt include | ||||
|---|---|---|---|---|
|
Displaying Data Labels
| If you want to show data belonging to individual data points in an analysis, use the button option Show/Hide data labels
|
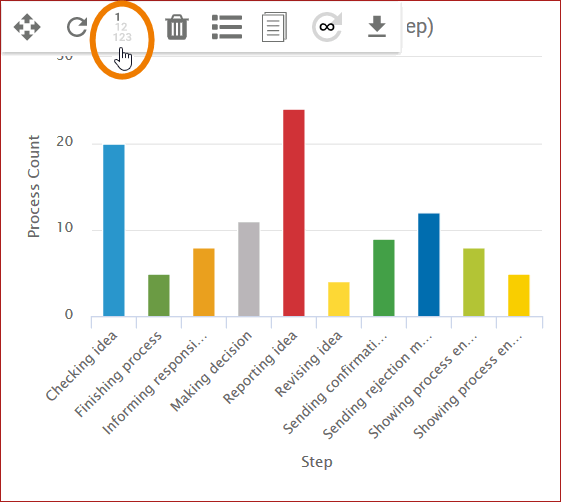
The button option - and thereby also the setting in the analysis - can show three versions of the analysis:
| Button | Analysis Display | Description | ||
|---|---|---|---|---|
|
| In the standard setting of the button, no captions are shown in the analysis. | ||
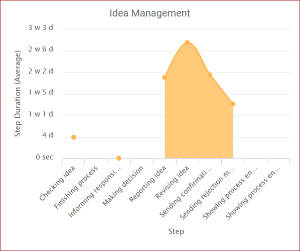
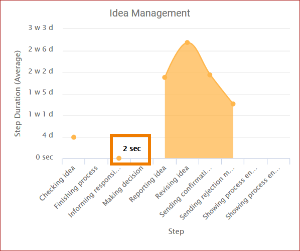
|
| After the first click on the button, only the captions for "low" values are displayed. In In this way, users can also make those values visible whose visual representation is not discernible at first glance.
| ||
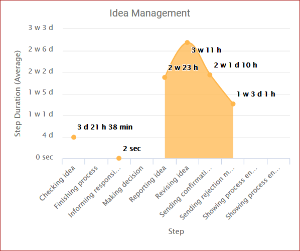
|
| If the button option is used again, the captions for all data points are displayed.
|
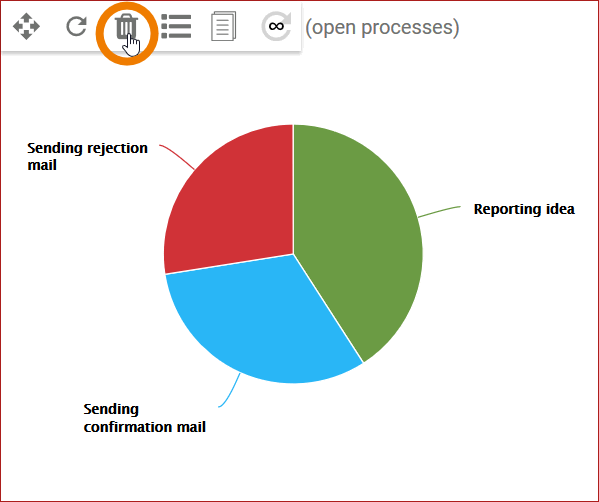
Deleting an Analysis
| Using the button |
| To complete the action, confirm the security question. |
Displaying the Instance List
When the button is clicked, Use option
to display the list of all instances belonging to the underlying process is displayed. The The list of instances enables a closer look at the raw data of the process to be looked at in more detail. The instance list can be configured according to need. It . You can configure the instance list according to your needs. It is also possible to filter instance list data independently of the analysis.
| Tip |
|---|
The Refer to Examining Instancespage explains in detail how to know more about how the instance list can be configured and individual instances viewedinstances can be viewed. |
Creating a Template
Click the button if you want to Use option
if you want to create a template from the current analysis.
| Tip |
|---|
Template creation is explained in Refer to Creating a Template for a step-by step guide on the Creating a Template page-step explanation on how to create templates. |
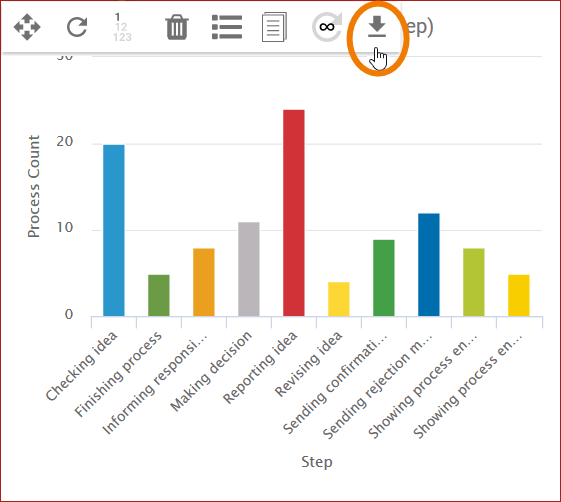
Setting Automatic Reloading
Click the Use option button if if you want to reload analysis data at a specified interval automatically.
You can set the following time intervals:
- 15 minutes
- 5 minutes
- 1 minute
- 15 seconds
Click the button option several times to switch between time intervals. The The interval selected is displayed at the center of the button:
Otherwise the data will only be updated as described under in Reloading an Analysis.
| Multiexcerpt include | ||||||
|---|---|---|---|---|---|---|
|
| Multiexcerpt include | ||||
|---|---|---|---|---|
|
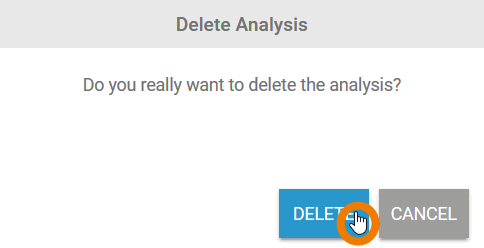
Saving Analysis as PNG
| Use this buttonoption |
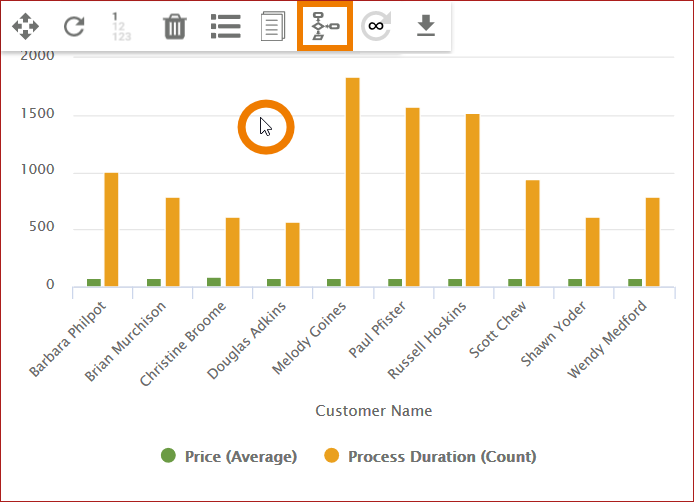
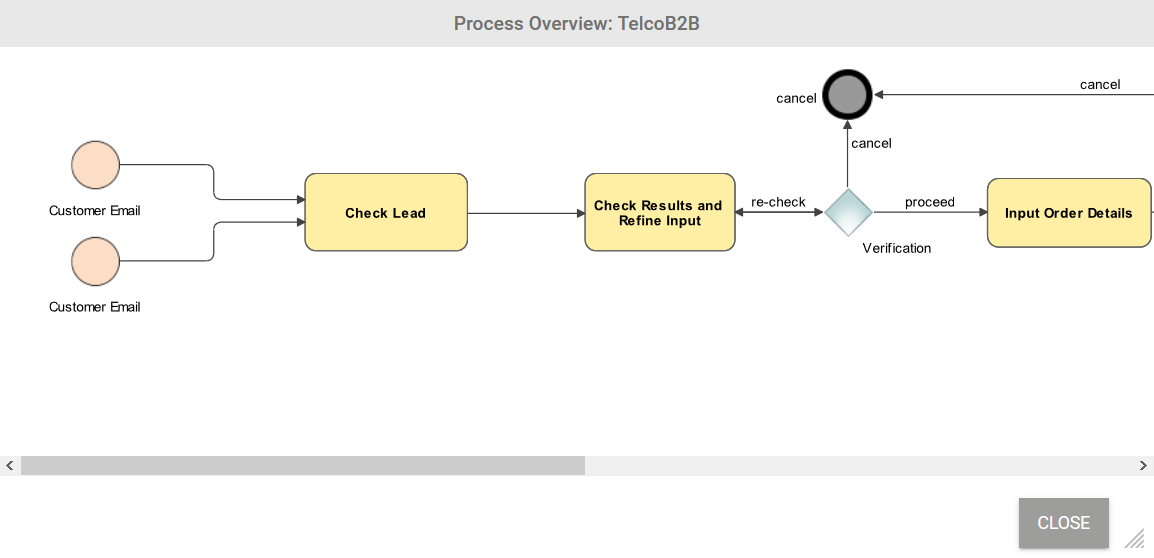
Displaying the Process Diagram
| For users of the Scheer PAS BRIDGE integration component (Bridge), the analysis menu contains an additional menu item: |
| This button option opens an overview of the BPMN model belonging to the process. |
| Panel | ||
|---|---|---|
| ||
|
| Panel | ||
|---|---|---|
| ||
Overview
Content Tools