Page History
| Div | ||||||
|---|---|---|---|---|---|---|
| ||||||
|
...
...
|

Click on a filename in the list to view the content
...
...
...
To delete an error dump file, click the corresponding Delete button. The file will be deleted without any further confirmation.
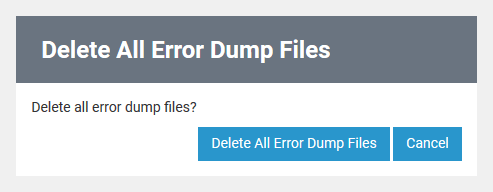
To clean up all error dump files, click Delete all Files.
| A confirmation dialog is displayed. The action needs to be confirmed or canceled. |
To download an error dump file, click the corresponding Download button. Once downloaded, an error dump file can be imported into the
...
Reading an xUML Service Dump
Setting the Bridge log level of an xUML service to Debug (see Preferences of an xUML Service), the full communication stream when using the URL or SOAP adapter is written to the bridgeserver log. This is especially helpful when debugging FTP problems. If the transferred data size exceeds 8192 bytes, the stream is cut. This would also be reported in the log.
...
...
Use the Bridge log level Debug with care and only when investigating problems. As all information has to be logged, it may result in significant loss of performance with increasing complexity of the deployed xUML service.
The following description explains how to generate and interpret the trace dump.
The trace dump will only be generated, if no trace request is sent via the E2E Analyzer (trace level in the test case properties set to None) and if the xUML service is running with disabled Trace (see xUML service details on the xUML Service tab).
If an error occurred, the generated error file will be specified in the error message displayed in the xUML service log (see Logging):
[2010-09-22 07:46:18 +0200][Error][Internal][FUASM][3][Division by zero - Error Trace: logs/error/error-2014-06-03_11-32-14_UTC-0.xml - Callstack: calculate > urn:Services.Calculation.Ports.CalculationPortType.calculate > Division > Division > Division(1)]
The error file is located in the directory of the xUML service (location: <your bridge data directory>\<name of the service>\logs\error). It contains the call stack and the corresponding XML trace of the activity diagram where the error occurred.
...
|
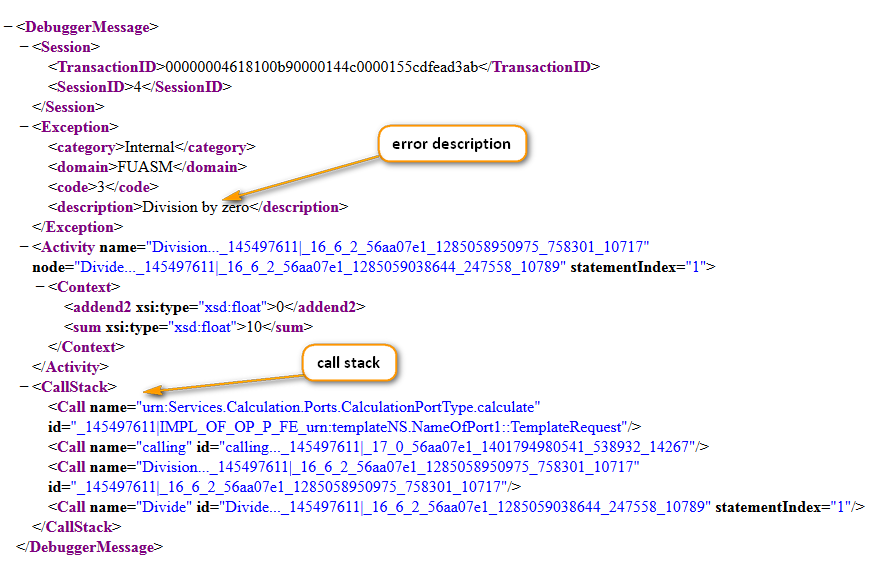
Interpreting the XML of an xUML Service Dump
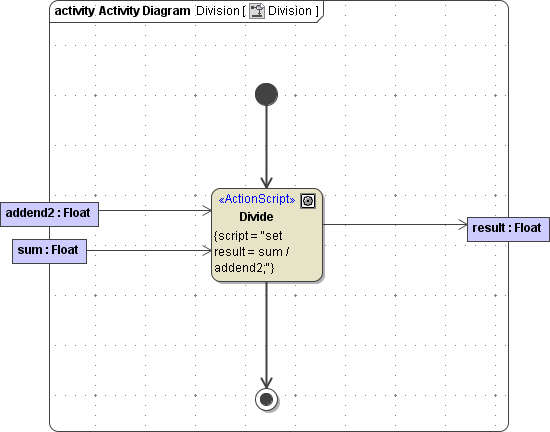
The following example shows the error dump created due to a division by zero. The error will occur in action node Division of activity diagram Division.
| Note | ||
|---|---|---|
| ||
In the XML trace, object flow states do not have a name but only numbers. |
...
Overview
Content Tools