Page History
...
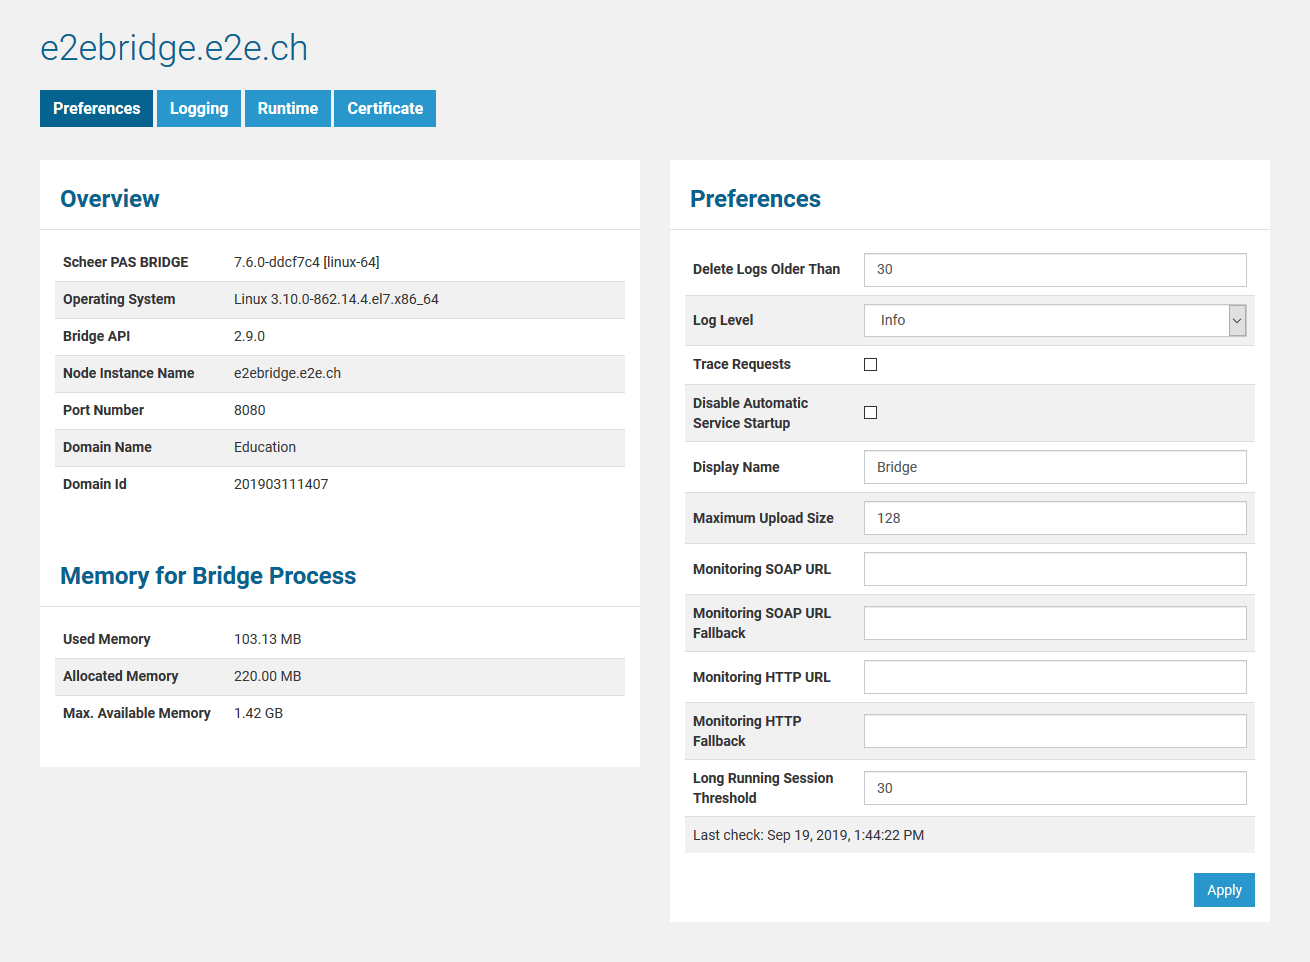
Figure: Node Instance Preferences
Overview
In the Overview section of this tab, the following information about the selected node instance is displayed:
| E2E Bridge InstallerScheer PAS BRIDGE | Version number and operating system of the installer that has been used to install/update the E2E Bridge. |
| Operating System | Operating System the E2E Bridge is running on. |
| Bridge API | Version number of the Bridge API. |
| Node Instance Name | Host name of the selected node instance. |
| Port Number | The port number, to which the Bridge on the selected node instance is listening (defined during the installation of the Bridge). |
| Domain Name | Name of the domain, the node instance is part of. |
| Domain ID | Unique ID of the domain. |
...
In the Memory section of this tab, the following information about the memory usage of the E2E Bridge process (process E2E-Console-<name of the host>, not the running services):
| Used Memory | Memory used by the E2E Bridge process right now. |
| Allocated Memory | Memory that has been allocated for the E2E Bridge process. |
| Max. Available Memory | Memory that is available for the E2E Bridge process. |
Preferences
In the Preferences section of the information/working area, the following settings can be applied:.
| Delete Logs Older Than | Bridge 7.6.0 Specify the number of days that log files should be kept. Each night at 00:00 pm (fix), older log files will be deleted automatically. If you specify 0 days, the log files will be kept forever, default value after installation of the Bridge is 30 days.
| ||
| Log Level | The software components of the Bridge log activities like deployments, import of node instances into a domain, firmware package uploads, etc. according the selected log level. The higher the log level the more information will be written to the log files. See Bridge Log Level for more details on these log levels. | ||
| Trace Requests | Only used for troubleshooting and only works, if log level Trace has been chosen. Selecting this option will generate tracing files that can be examined by the E2E support. Use this option carefully, as it generates large amounts of data. | ||
| Disable Automatic Service Startup | Each deployed Bridge service has am Automatic Startup flag (see Preferences of an xUML Service, Node.js Service Details and Java Service Details for more information on this flag). For e.g. server maintenance reasons, when you need to reboot the server several times, it can be useful to disable this flag for all services. As long as this option is selected, the Bridge will ignore all service specific Automatic Startup flags. | ||
| Display Name | By setting Display Name, the name of the Bridge and of the browser tab can be changed, e.g. to the name of the server as shown below. Note: The user interface will show the display name of the Bridge you are currently using (see browser URL). Additionally imported node instances could have different display names that will be displayed when using their user interface. | ||
| Maximum Upload Size | Maximum size of files in MB that can be uploaded to the E2E Bridge. This limit refers to repositories, resources and Runtime packages. | ||
| Monitoring SOAP URL | Optional monitoring of xUML services. If an xUML service has an error or crashes, the registered monitoring service will be called. The service call timeout is 3 seconds. The second monitoring service backups the first and will be called if the first monitoring service call fails. For more details, refer to Monitoring. | ||
| Monitoring SOAP URL Fallback | Optional monitoring fallback. | ||
| Monitoring HTTP URL | As an alternative to a SOAP URL (see Monitoring SOAP URL), you can specify an URL to a monitoring REST service here. | ||
| Monitoring HTTP URL Fallback | Optional REST monitoring fallback. | ||
| Long Running Session Threshold | Monitoring threshold specified in minutes. If a service is occupied longer than the defined threshold, the monitoring service is called. Refer to Monitoring for more details. The check runs twice during the defined threshold time. To disable the threshold enter 0. |
...
Logged data is stored in your E2E Bridge DATA directory at E2E_BRIDGE_DATA/servlets/logs in several subfolders (before Bridge version 5.1.5: E2E_BRIDGE_PROG/servlets/logs). You can inspect the logged information on the Logging tab as described in Inspecting the Logging Information.
Overview
Content Tools