Page History
Using the Services' List
|
| ||||||||
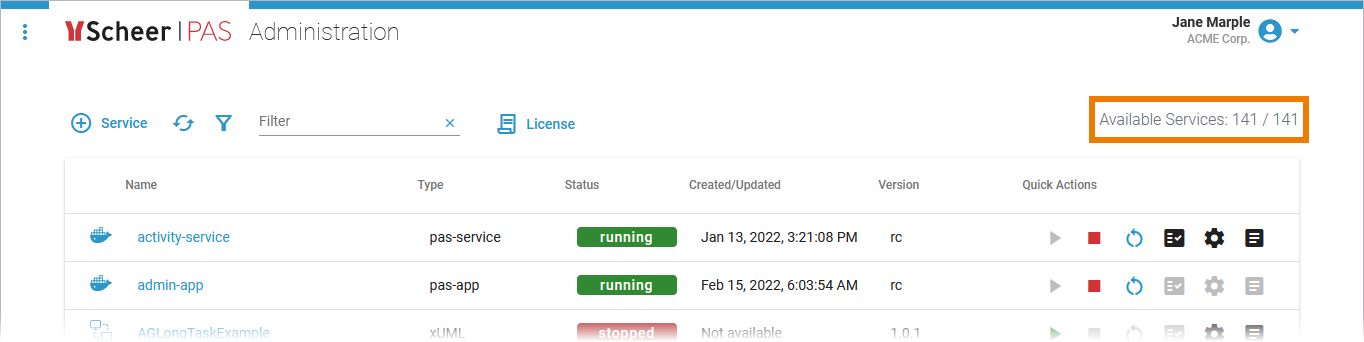
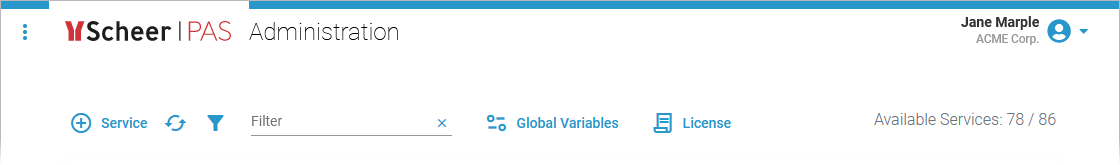
| In the navigation bar of the services' list you can find two options and a filter field:
|

Managing Services
The list of services shows all available services of the platform:
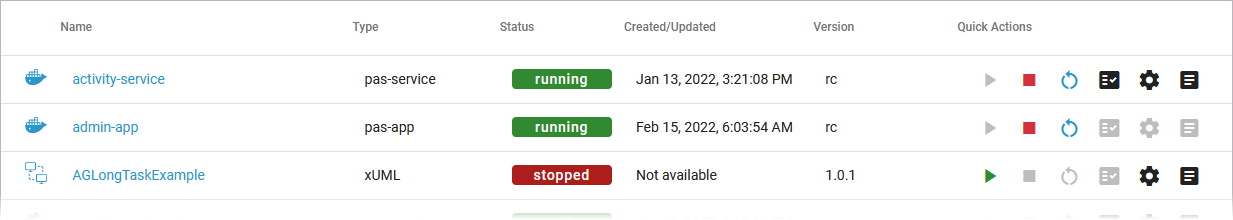
The list contains the following information:
| Column Name | Description | Possible Values DOCKER | Possible Values INTEGRATION (Bridge) | ||||||||||||||||||||||||||||
|---|---|---|---|---|---|---|---|---|---|---|---|---|---|---|---|---|---|---|---|---|---|---|---|---|---|---|---|---|---|---|---|
| Name |
|
|
| ||||||||||||||||||||||||||||
| Type |
|
|
| ||||||||||||||||||||||||||||
| Status |
| ||||||||||||||||||||||||||||||
| Created/Updated |
|
| |||||||||||||||||||||||||||||
Version |
| - |
| ||||||||||||||||||||||||||||
Quick Actions
The quick action icons grant direct access to the applicable actions for each service.
| Icon | Description | ||||||||
|---|---|---|---|---|---|---|---|---|---|
| Use this icon to start the service. | |||||||||
| Use this icon to stop the service. | |||||||||
| Use this icon to restart the service. | |||||||||
Use this icon to change the log level.
| |||||||||
Use this icon to change the service configuration.
See page Adapting Service Configuration for further details. | |||||||||
Use this icon to access the service logs.
See pages Showing Service Logs and Using Kibana for further details. |
Filtering the Services' List
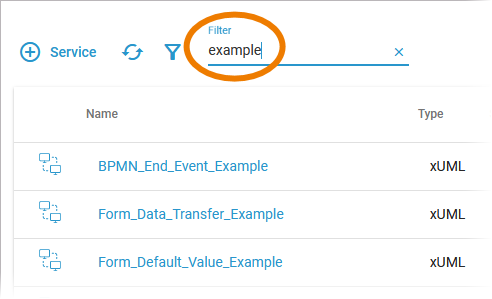
| Use the filter field to search for a specific service. The content of the filter field is applied to the services' names. The red filter icon indicates that a filter is applied. | |||||||||
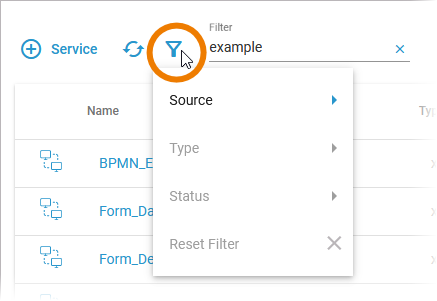
| Click the filter icon to display the extended filter options:
The content of Type and Status depends on the selected Source:
| |||||||||
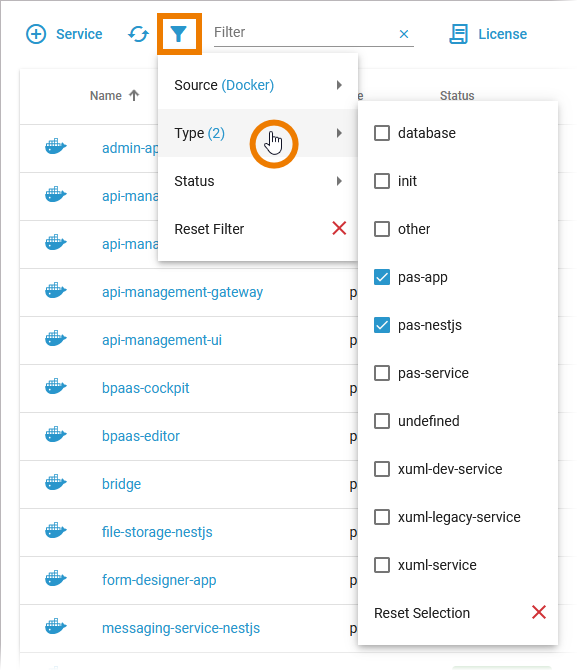
| If a filter is applied, the filter icon changes: The extended filter allows you to select multiple types and states. | |||||||||
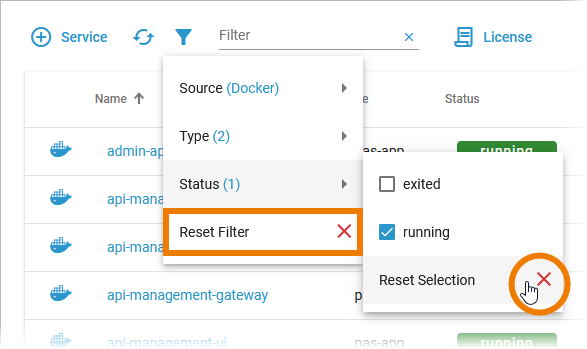
| In the main filter window, you can reset all selected filters. Click icon In each filter option window, you can also reset the specific selection. |
Overview
Content Tools