Page History
...
Main Features
API Management
The API-Management of E2E BRIDGE 7 comes with Scheer PAS API Management. API Management offers a maximum of control regarding administration and optimization of your APIs. You can setup different permission levels for usage and administration of APIs, services and clients, and control the publishing of contracts in real-time in a flexible way. Access to the interfaces is possible either via (immutable) contracts or via use of public APIs.
| The API Management solution |
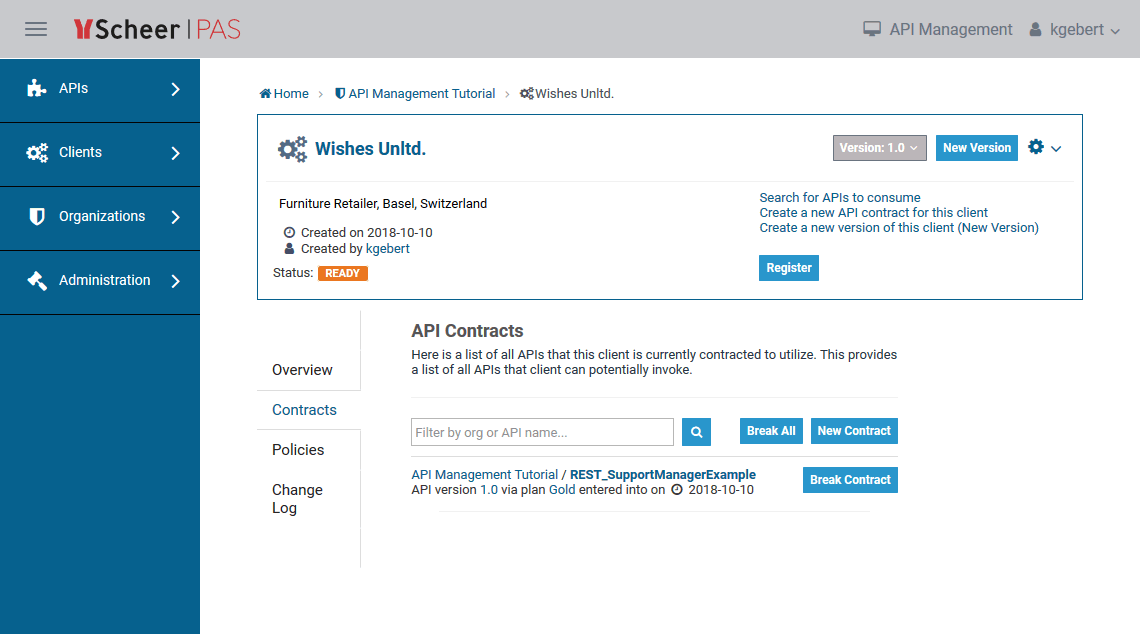
has three components which can be deployed on different host to get maximum performance and stability: |
|
|
|
|
|
API Management is based on apiman and Keycloak. For more information, refer to the |
APIMGMNT documentation. |
...
Process
...
Mining
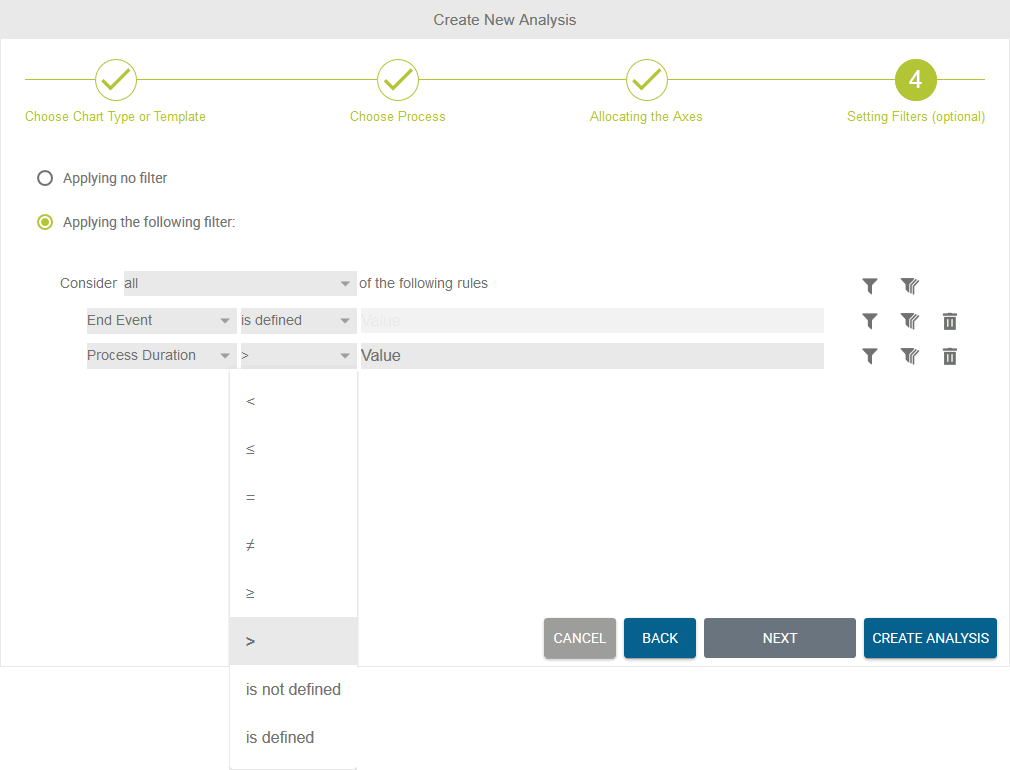
The E2E Process Dashboards have been completely redesigned. The new Scheer E2E PASProcess Analytics Mining allows for intuitive and easy creation of new analyses and comes with significant performance improvements.
|
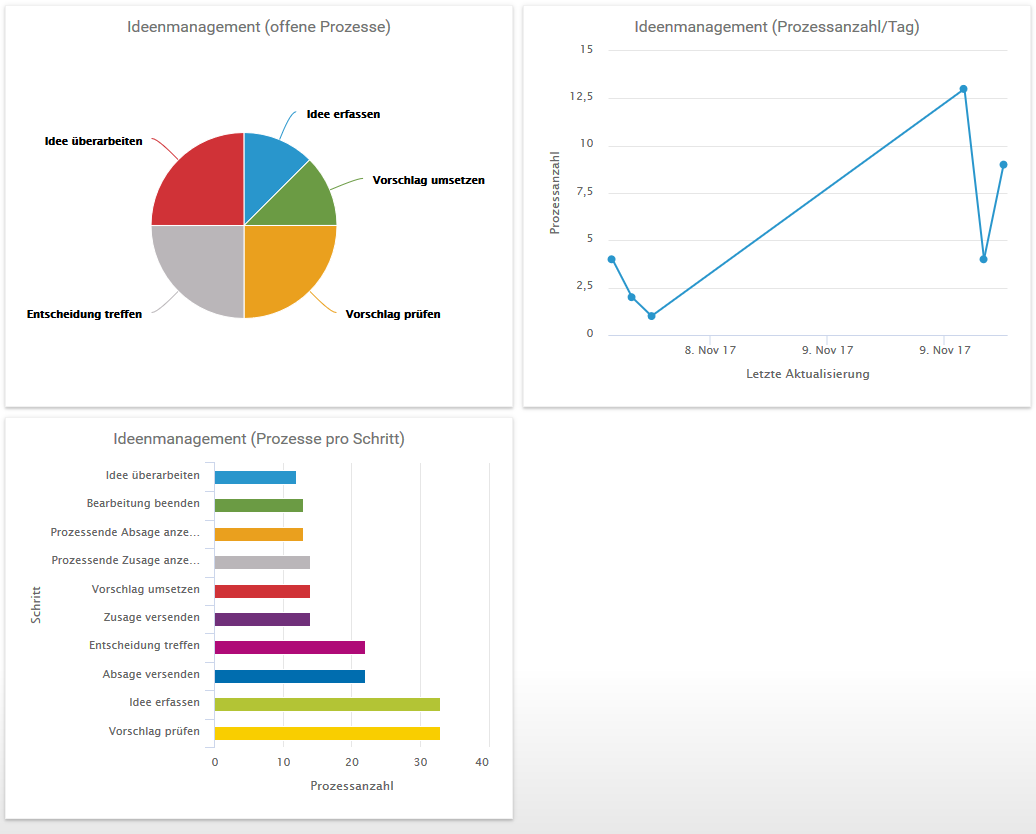
Process |
Mining comes with a personalized dashboard view. Manage all your analyses on one page!
| |
| Create your diagrams to your needs.
|
| Analyze process variants and their frequency with the Process Explorer to get a deeper insight to your business processes and find potential for optimization.
|
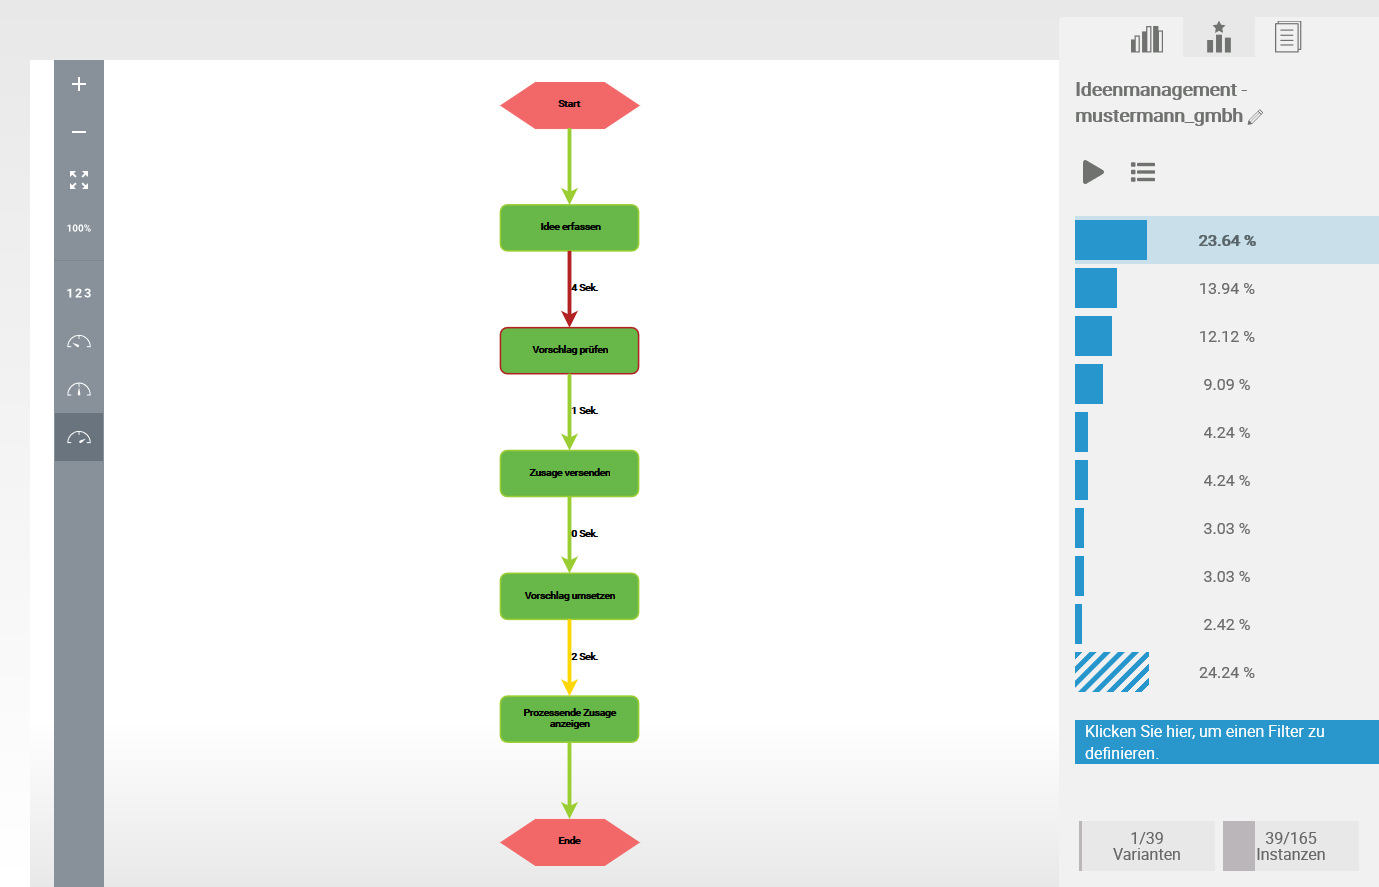
For more information, please refer to to the official Process Analytics Mining documentation (German only).
New Adapters
...
The feature includes pre-built service templates including a user interface for configuration of transport channels and communication partners.
OData Support
The E2E BRIDGE now supports OData for querying and updating databases using REST. The protocol allows Web clients to get, publish and edit database resources using simple HTTP messages. Using OData, you can easily integrate with SAP NetWeaver Gateway, Microsoft Dynamics NAV, Microsoft Office 365, Microsoft Sharepoint and more.
For more information on the OData Adapter, please refer to OData Adapter and Importing OData.
Continuous Delivery with the
...
BRIDGE
- Based on a straightforward and repeatable process, the continuous delivery approach helps with building, testing and releasing software faster. You can automate your build, deploy, and testing processes using an automation tool together with the E2E BRIDGE command line tools.
For more information, please refer to Continuous Delivery with the E2E BridgeBRIDGE. - For automation purposes, all Bridge functions can be accessed via a REST interface.
For more information, please refer to E2E Bridge BRIDGE API. - The E2E BRIDGE Command Line Interface has been reworked and now offers many new features. You now can access most of the actions of the E2E BRIDGE API via the CLI.
- viewing and setting the service preferences and the service settings of xUML, Node.js and Java services
- advanced handling of xUML services (list services, view status, view/change service documentation, list/cancel running sessions, download repository)
- resource handling (list, upload, delete)
- listing global variables
...
Windows Server 2016 now is supported officially as a system to run the E2E BRIDGE on.
New BRIDGE Design
| We have redesigned the user interface of the |
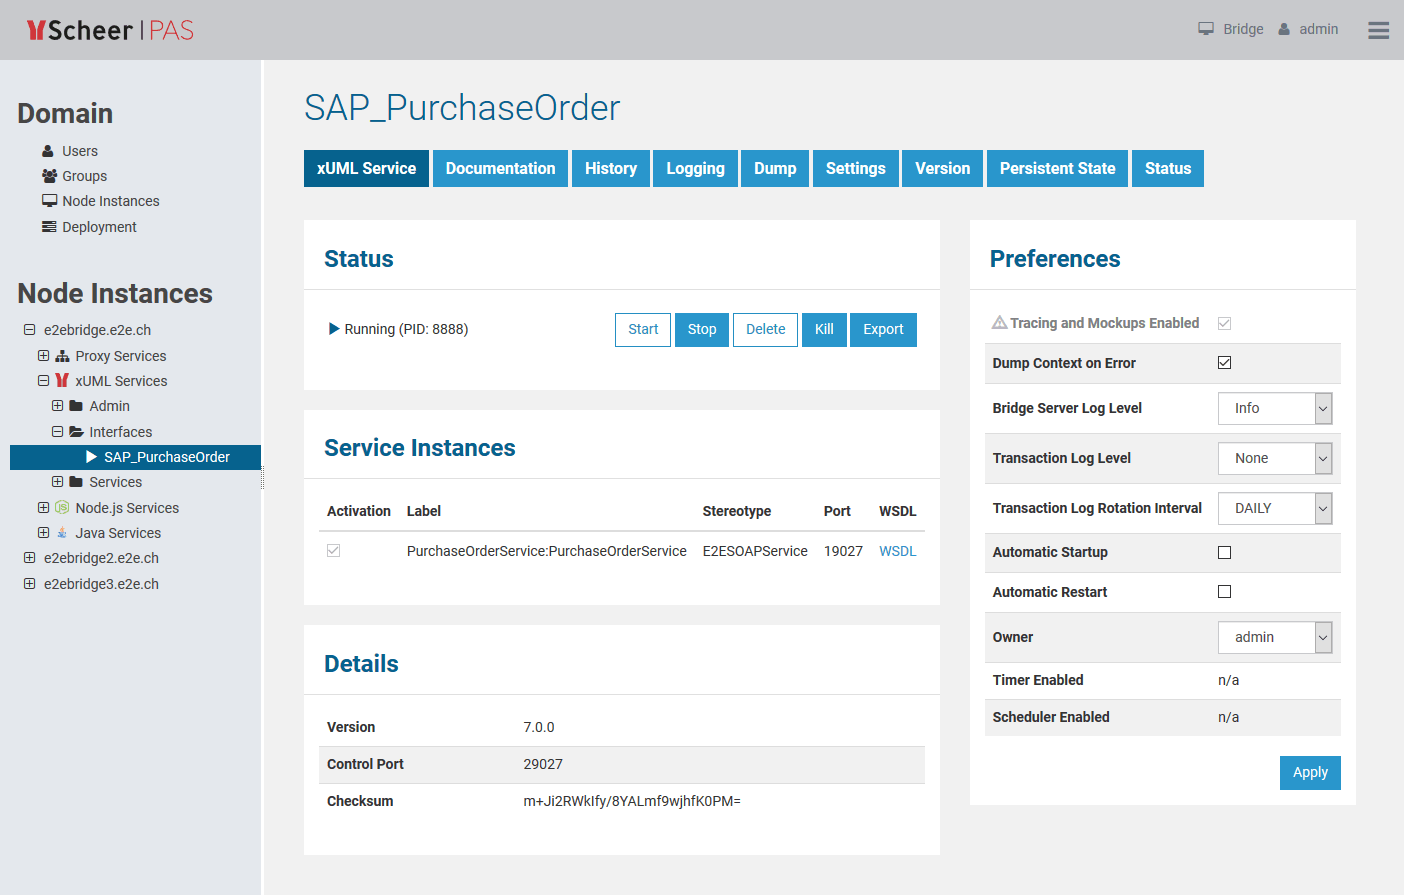
| BRIDGE to give you a smoother user experience. |
Improved Search in Log Files
| We have refurbished the Logging tab in the user interface of the |
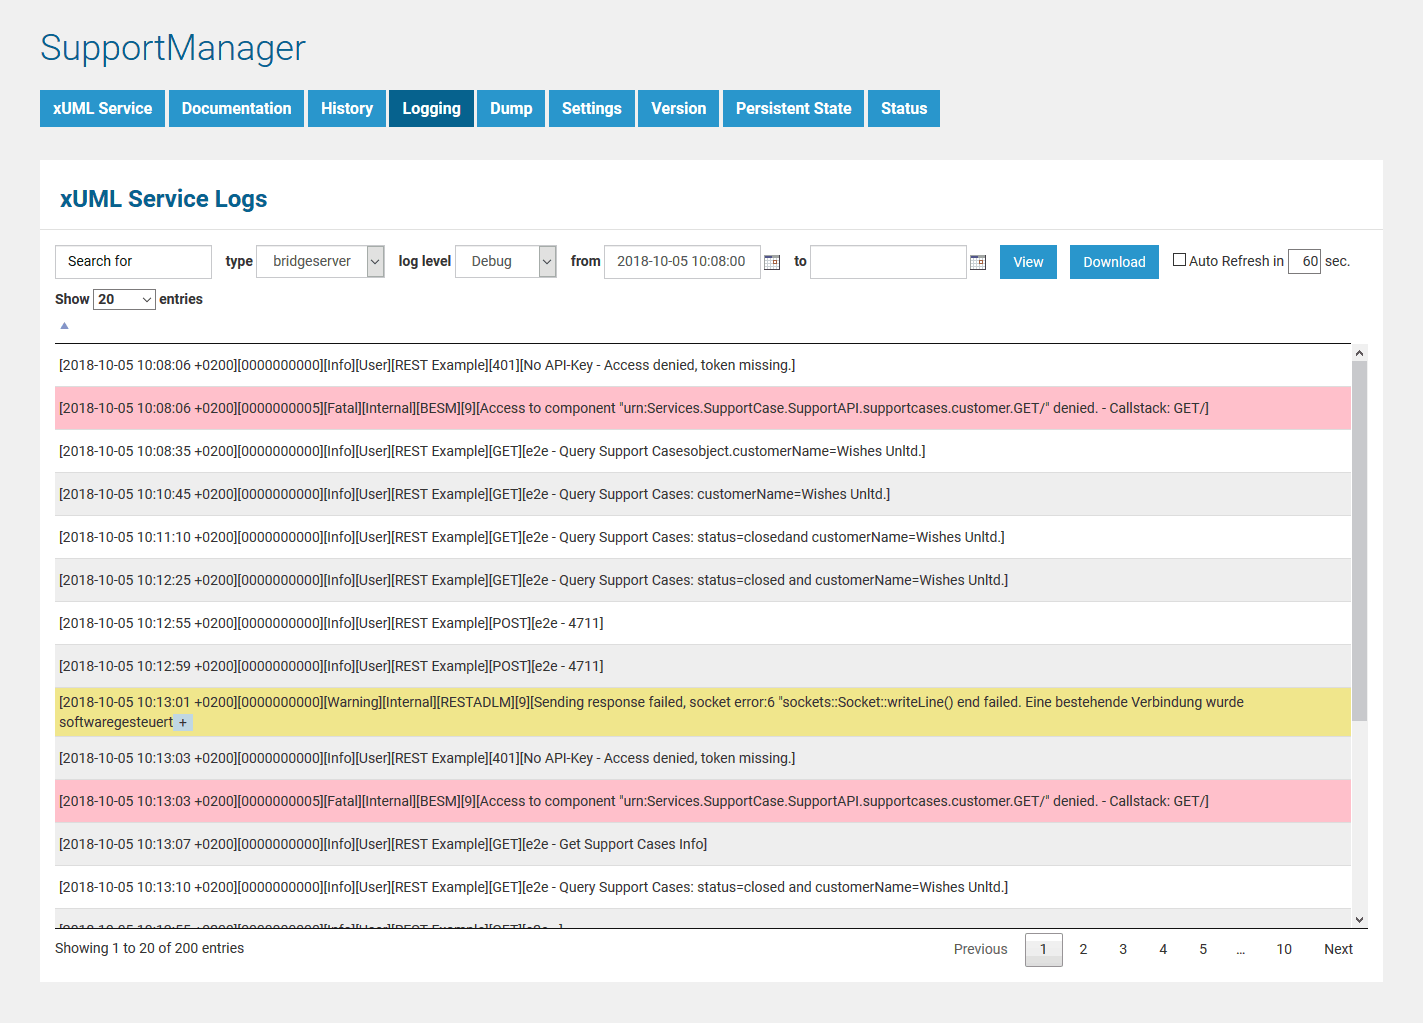
| BRIDGE. You now can use regular expression to search the logs and even search throughout all existing logfiles of the service. For more information, please refer to Logging of xUML Services. |
Configurable Service Port Numbers
| Front-end service port numbers now are configurable on the |
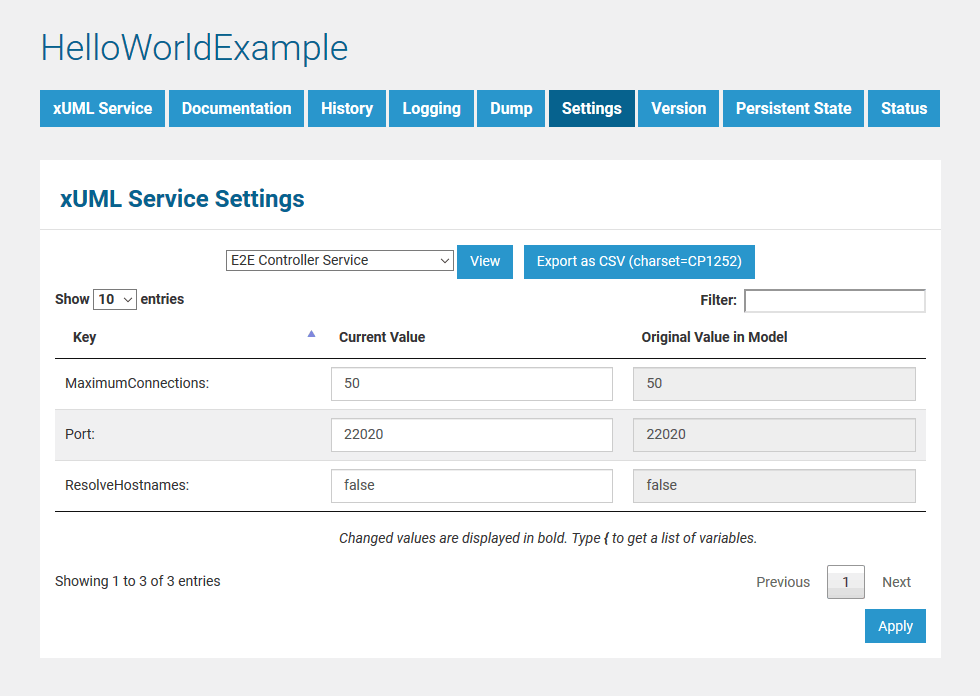
| BRIDGE. |
Technical Changes
We updated some underlying software to newer versions:
- Node.js updated to version 8 (Carbon)
- JRE Java updated to version 8u15311
- proxy updated to Apache httpd version 2.4
- TLS 1.3 supported
New Features for Modelers
Lots of new features, improvements and bug fixes for E2E BUILDER, E2E ANALYZER and E2E BRIDGE help developers to create better services:
- extended BRIDGE API: delete service, export xUML service, deploy service, get/put global setting variables, get/delete service sessions, kill service (see Bridge BRIDGE API)
- REST, HTTP and SOAP services support IPv6
- REST Adapter supports media type parameters
- SQL Adapter requests can be cancelled (see E2E see BRIDGE Status Tab )
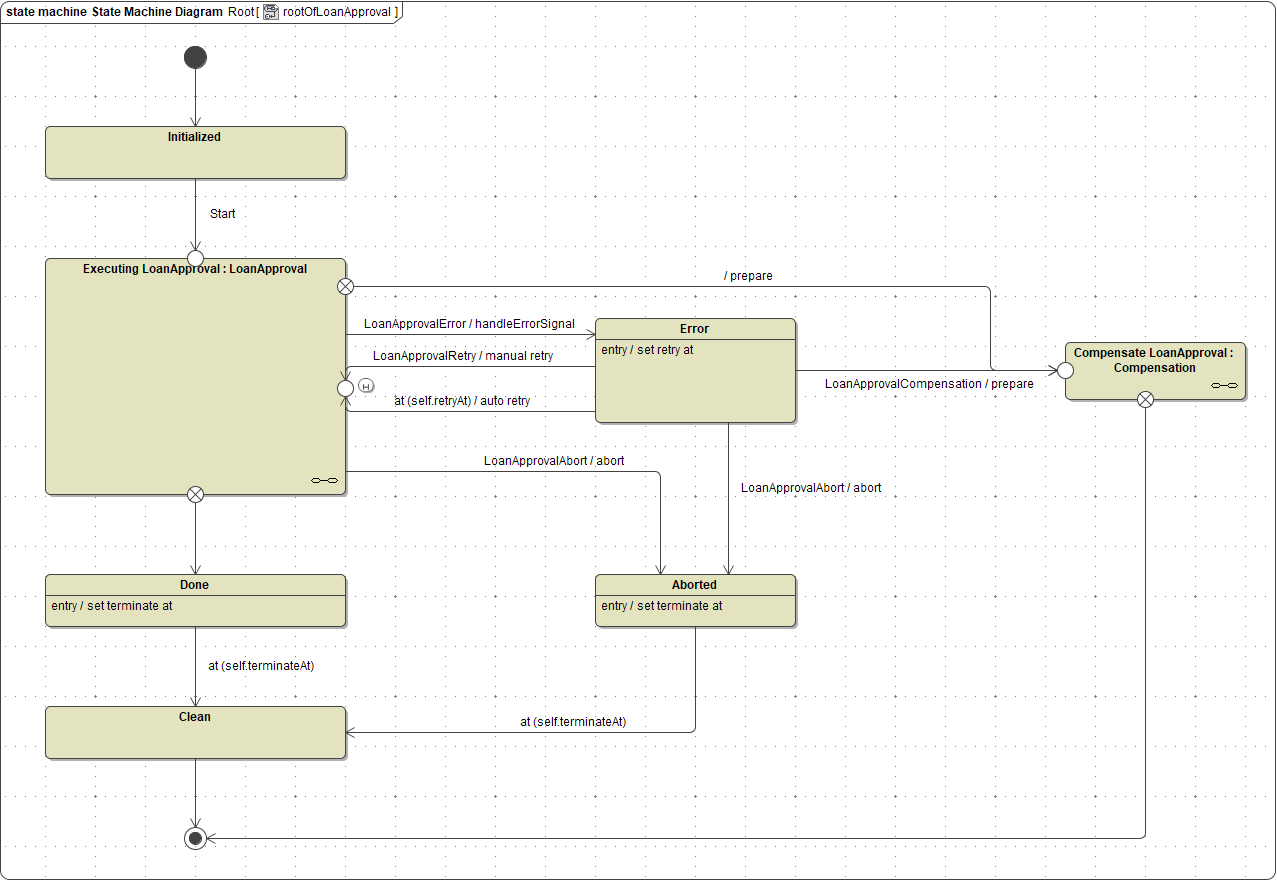
- Improved BPMN root state machine with more complex error and retry handling (see The Model Implementing the BPMN Process and BPMN Default Error Handling)
- File System Adapter and Flat File Adapter allow for setting a static root path together with a dynamic file name (see File System Components)
- Analyzer allows to start a test suite via command line (see Running Regression Tests From Command Line )
- and many, many more ..
...
Overview
Content Tools