Page History
| Div | ||||||
|---|---|---|---|---|---|---|
| ||||||
|
...
...
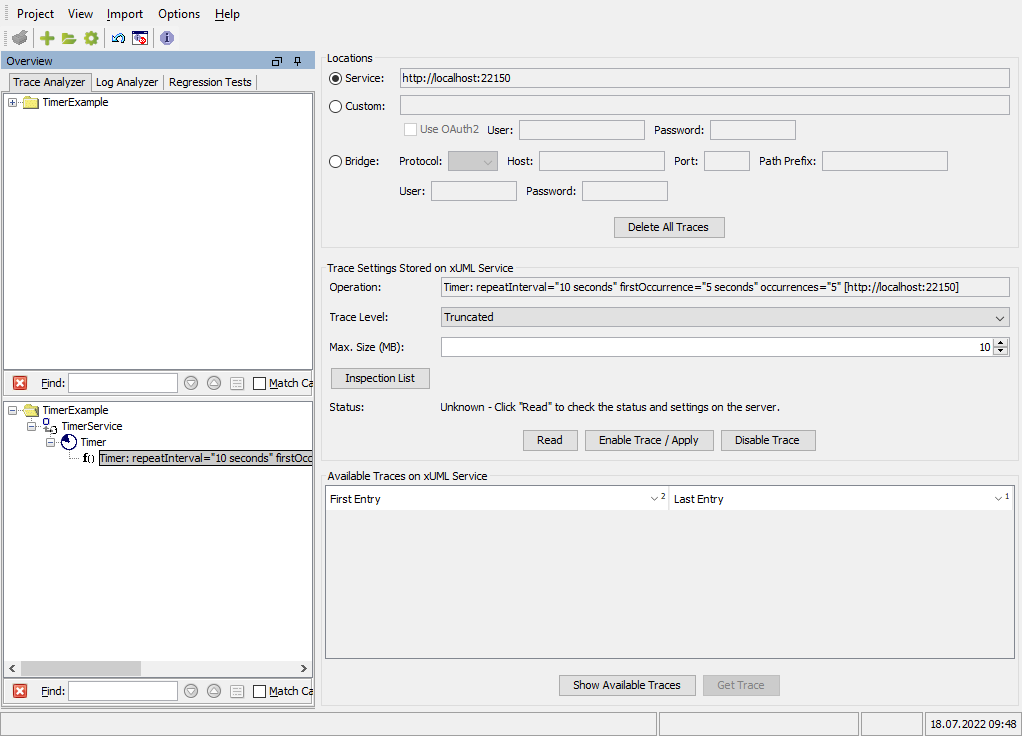
Bridge, the Trace Analyzer displays the following:
| Otp | ||
|---|---|---|
|
| Rp |
|---|
If you want to know more on the information displayed in the Overview window, refer to Contents of the Asynchronous Part in Managing Service Descriptions.
For more information on timers refer to Timer Service.
Changing the Asynchronous Trace Settings
You can change the asynchronous tracing settings for the service operation selected in the Overview window.
The asynchronous trace settings window consists of three parts:
- the service location
- the effective trace settings
- the list of collected trace information
The Service Location
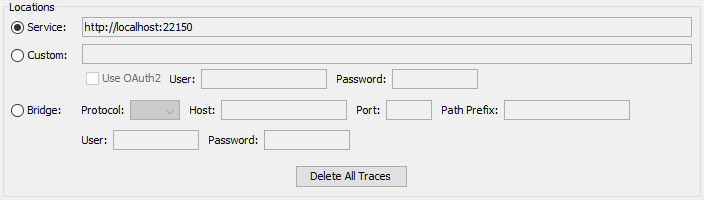 | Concerning the service location you can switch between the location the service was originally deployed to or a custom location. |
...
...
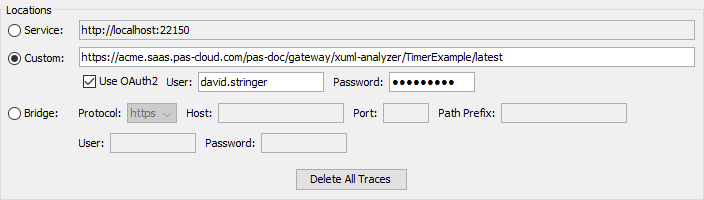 | Select Custom Location and enter the URL to the custom service location. This can be used, e.g. if the very same service has been deployed to multiple Bridges. |
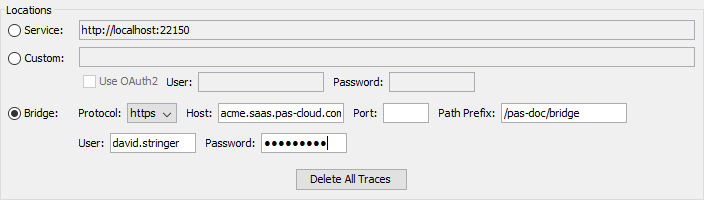 | Select E2E Bridge, enter protocol, name and port of the Bridge the service is running on and provide valid credentials. If necessary (e.g. if you want to connect to a service running on a Bridge behind a proxy), specify a path prefix that will be added to the service path. |
...
In this case, the Analyzer can access the service via the |
...
The authentication must be of a valid Bridge user. |
...
Refer to Group Roles for more information on Bridge roles and to Secure Bridge Setup for more information on securing your |
...
Bridge. | |
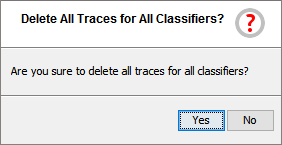
| Click Delete All Traces to remove all of the collected tracing information from the specified service location. You will be prompted for confirmation. |
The Trace Settings
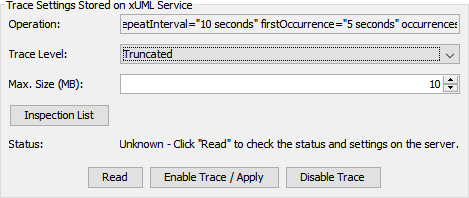 | Change the trace settings for the displayed operation. |
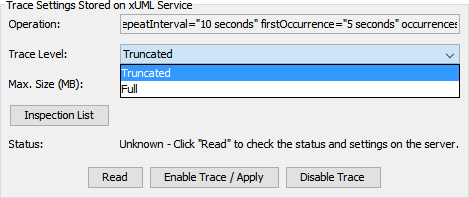 | Choose between three trace levels:
|
...
| |
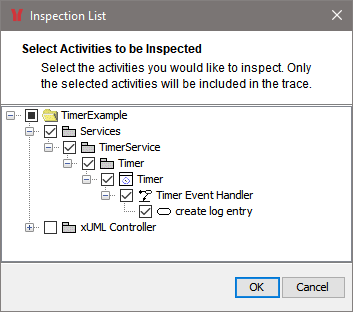 | Click Inspection List to select activities you want to inspect. Tracing information will be collected for the selected activities only. |
Click Enable Trace / Apply to apply any change of settings.
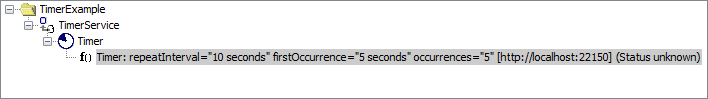
The Status messages displays that the tracing status of the service operation is yet unknown.
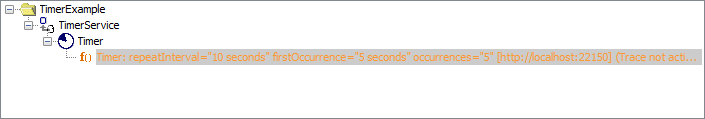
Click Read to read the actual tracing status of this service operation.
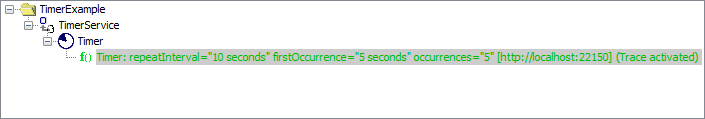
If no tracing is activated on the service operation, you can activate tracing by clicking Enable Trace / Apply.
The E2E Runtime starts collecting tracing information on service calls.
By clicking Deactivate tracing can be deactivated.
Viewing Available Traces
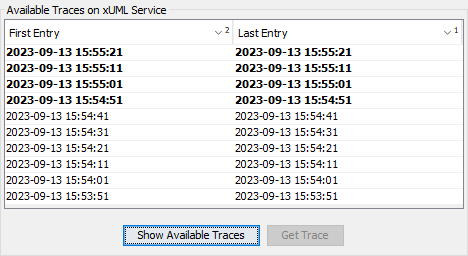
Click Show Available Traces to reload the list of traces that are available on the specified Bridge.
| New traces are marked in bold. |
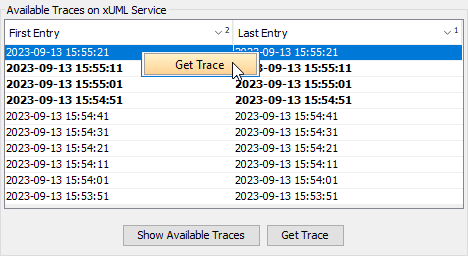 | Select Get Trace from the context menu or click the Get Trace button to download the tracing information from the |
...
| Bridge. |
The Analyzer displays the downloaded trace in the content pane and switches to the UML tab to let you browse through the execution path of the service call.
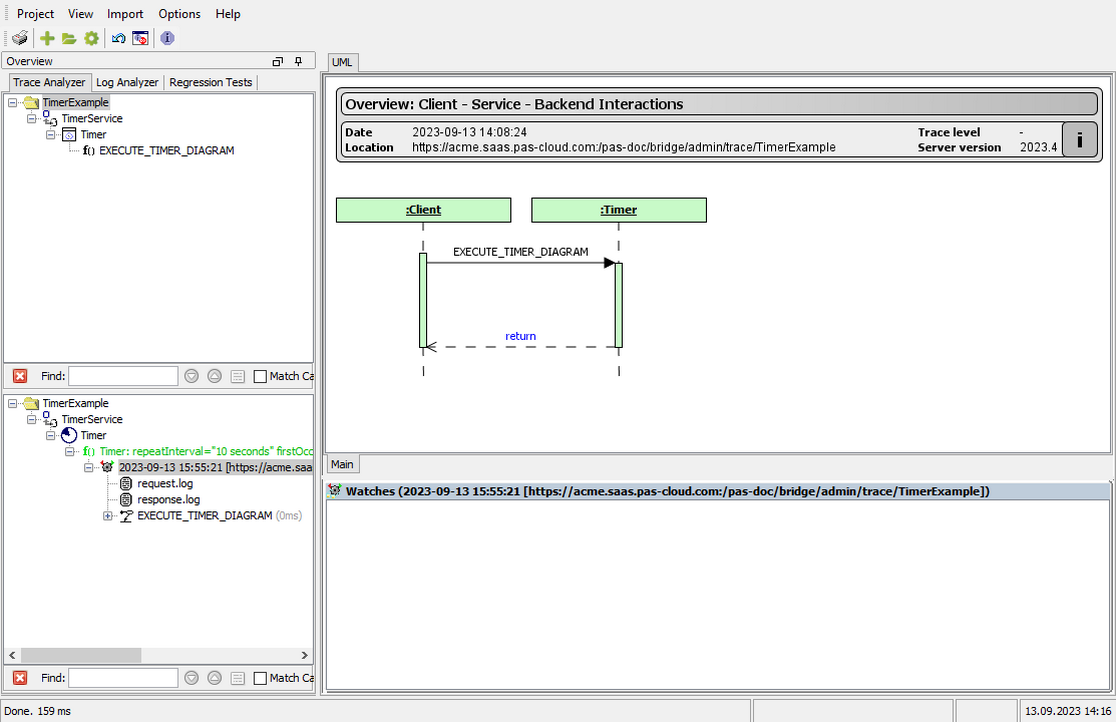
Additionally, you can inspect the request.log and the response.log of the service call.
Sorting and Filtering Available Traces
Having downloaded multiple traces (see Viewing Available Traces above), the list may be very long. You can sort table columns, and filter the table to reduce the amount of displayed traces.
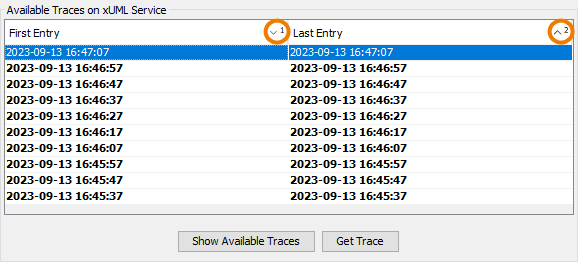
To sort the list of traces, click the column header of the column you want to sort by.
The first click will sort the column data ascending.
The second click will sort descending.
The third click resets the column data to the original order.
To sort on multiple columns, press Ctrl and hold while clicking on another column. A number is displayed in the header to indicate the sort rank of the selected column.
To filter the traces, hover your mouse over the table heading, and click the filter icon.
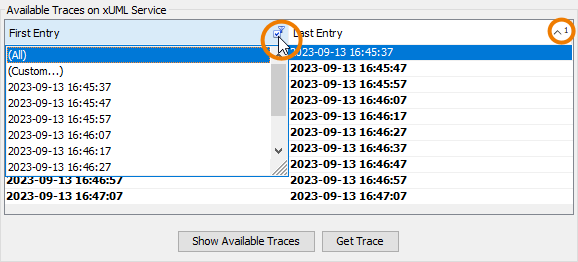
From the filter menu, you can select
- all to display all traces and remove previously added filters
- Custom to specify a custom filter
- a list of values from the table to display traces having the corresponding value
Once a filter has been applied, this is indicated by the filter icon (![]() ) in the table header.
) in the table header.
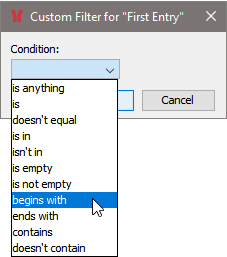
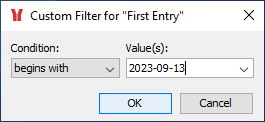
| To apply a custom filter, you can select from a list of conditions, and - for some filters - add a value.
|
Searching Available Traces
Additionally, you can search the tree of the downloaded traces using the Find field at the bottom:
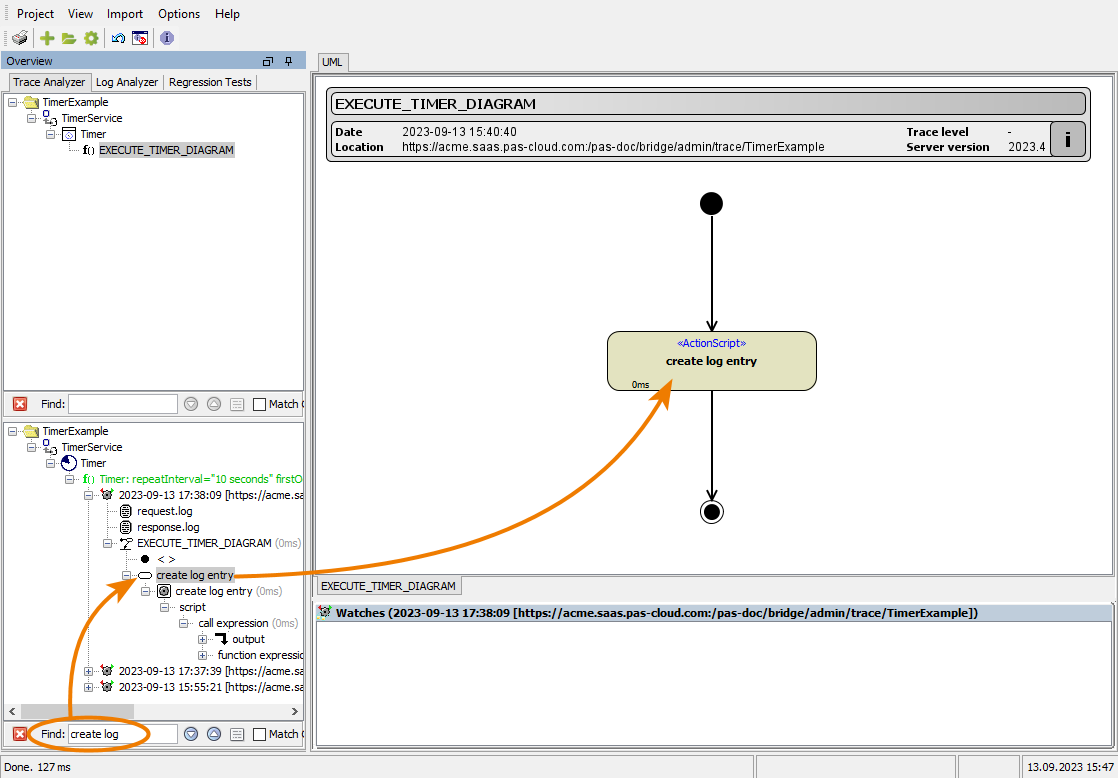
The tree expands and displays the first item that has been found. Additionally, this item gets displayed in the execution path of the trace. For more information the UML diagram in the content pane, refer to Browsing through the Execution Path of the Service.
You can use the arrow keys ( and
) to search for further instances of the search term.
Overview
Content Tools