Tracing through the Service - Lesson 2
Switch to the UML tab.
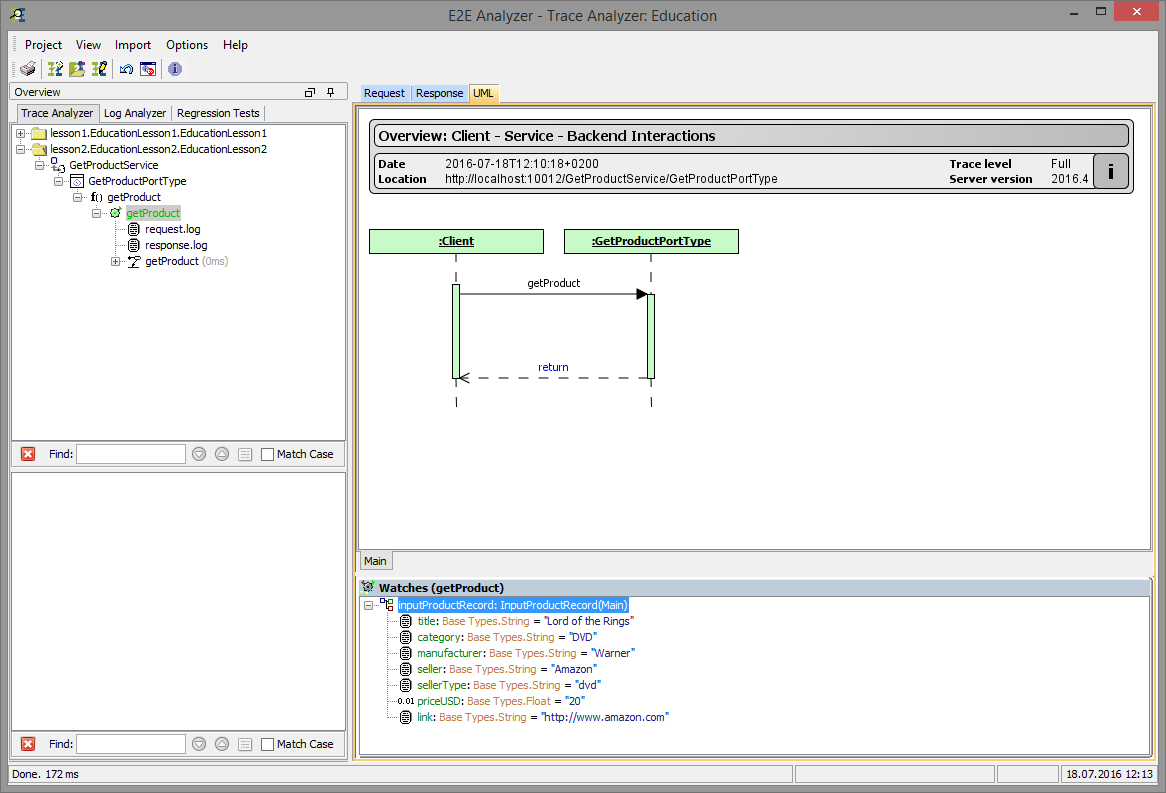
A graphical debugging tool starts up, which helps you to follow the trace of the executed action flow. You can see a sequence diagram created by the server at runtime. It displays the actions executed by the Web service.

The sequence diagram has sensitive areas. By clicking and holding an object, you can drag and drop it. Move the mouse over the SOAP operation getProduct on the arrow pointing to the right and click the right mouse button. Select Show parameters > inputProductRecord:

The input runtime value of the getProduct SOAP operation will be shown in the Watches list in the lower panel:

Right clicking return on the response arrow pointing to the left and selecting Show parameters > outputProductRecord you can see the runtime value of the output object returned by the SOAP operation in the Watches panel as well.
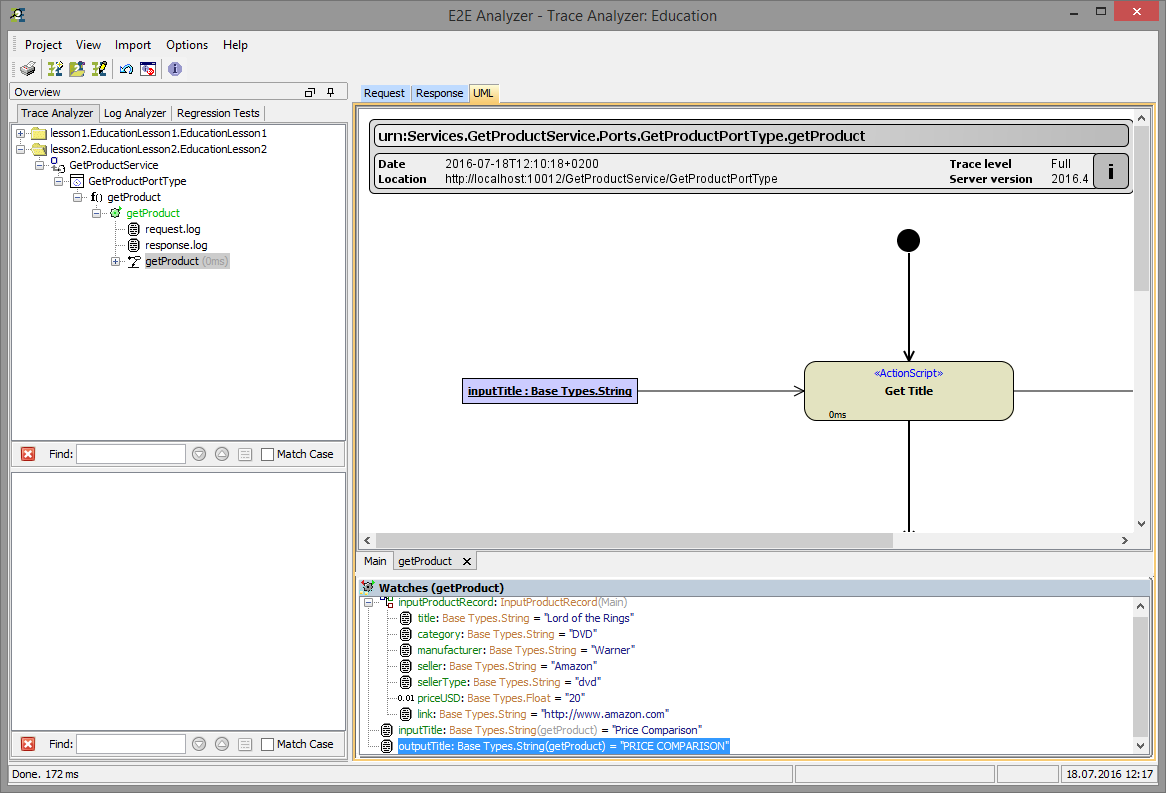
Now, double-click the operation name getProduct. If you set the Trace option before you compiled the xUML service and set the trace level to Full trace in the test case properties the picture below appears. It shows the activity diagram that was assigned to the SOAP operation in the UML model:

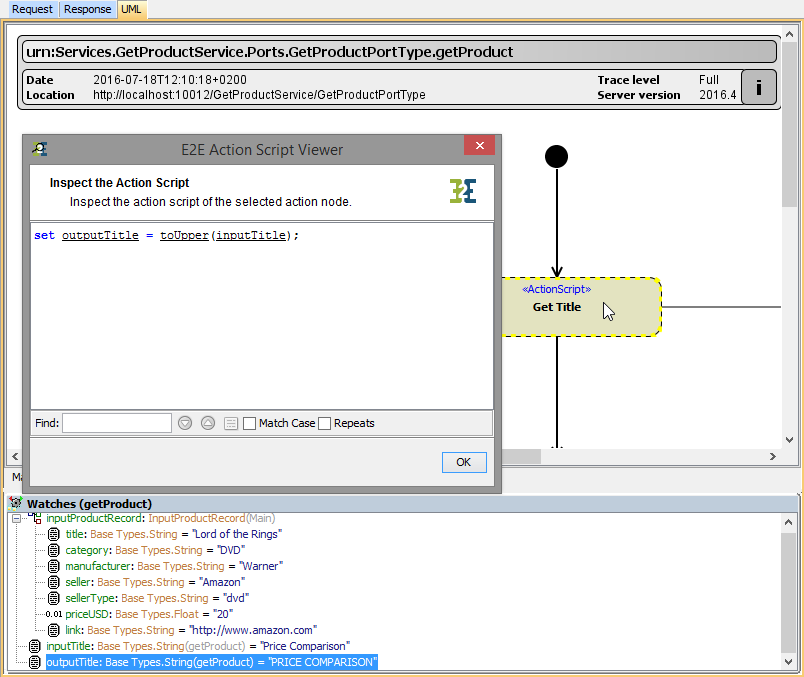
Double-clicking mouse-sensitive items, more runtime information generated during the execution of the model will be displayed. For example, double-click the action node Get Title to open the action script in the Action Script Viewer. The Action Script Viewer shows action script with all runtime values.

Underlined variable names within the Action Script Viewer indicate that actual runtime data can be viewed. Click inputTitle to open the Text Viewer, which shows the value Price Comparison:

Navigating this way, you can browse through different levels of the UML diagram. Note that in the tree panel on the left, the corresponding UML elements are highlighted.
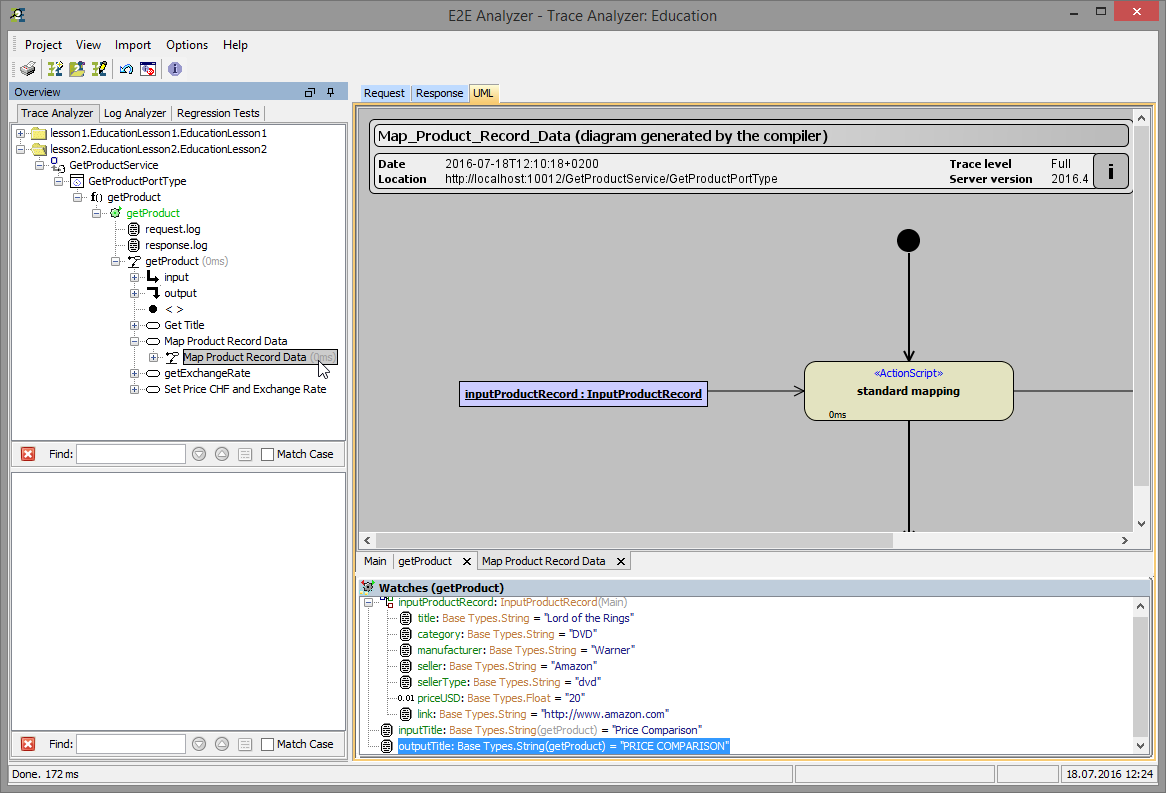
To trace through the model you can also navigate through the test case trace in the tree panel on the left. For instance, expand the action node getProduct and click the activity diagram node Map Product Record Data. The activity diagram opens in the UML tab:

Map Product Record Data contains a call of the mapping macro implemented by the <<Mapping>> stereotype. This activity diagram was generated by the Analyzer and is therefore displayed with a gray background.
Double-click standard mapping in the diagram to inspect the underlying action script. On the left you can see the set-statements the compiler generated form the <<Mapping>> stereotype:

Defining the data mappings between in- and output attributes with set assignment statements within action script often leads to a huge modelling and scripting effort.
E2E Bridge offers you a powerful and more convenient alternative. The attribute mappings are defined directly in a class diagram by drawing dependencies between the attributes of the involved classes. It is possible to create complex rules for the attribute mapping by defining the mapping rules on the <<E2ESimpleMapping>> stereotyped dependencies. For even more complex rules, for example if you have to do a look-up in a database, you can specify a <<E2EMappingHandler>> class.
The <<Mapping>> action then will internally translate all these declarations defined in class diagrams into activity diagrams with the needed set statements, decisions and iterations.
That is why this approach reduces your scripting and modelling effort significantly. Furthermore, you keep the attribute mappings maintainable, because they are not hidden in the action script, but are well documented in the class diagram.

Congratulations!
You have successfully finished lesson 2 of the Bridge Education.
