Testing the Service with the Analyzer - Lesson 3
Remember that Analyzer is the interface to the trace feature with which you can test all operations on the fly. It traces the execution path of a service that is run through the test. You can view this path graphically, e.g. in order to debug Web services or verify their correct functioning. Each operation defined on a port type can be tested with this tool. It makes no difference whether the service is running in the Embedded Runtime or has been deployed to a server.
For detailed information on the E2E Analyzer and it's features see the Scheer PAS | Analyzer Guide.
If you want to try out the Analyzer, refer to the Analyzer Installation Guide. There you will also find a link for downloading the Analyzer.
Starting the Service and the Analyzer
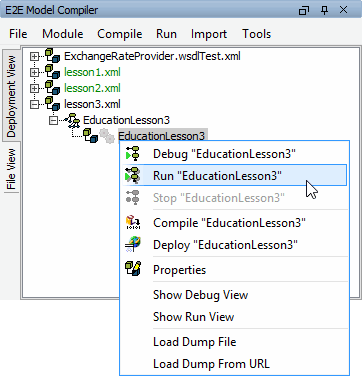
Start the education service of lesson 3 in the Embedded Runtime and start the Analyzer:

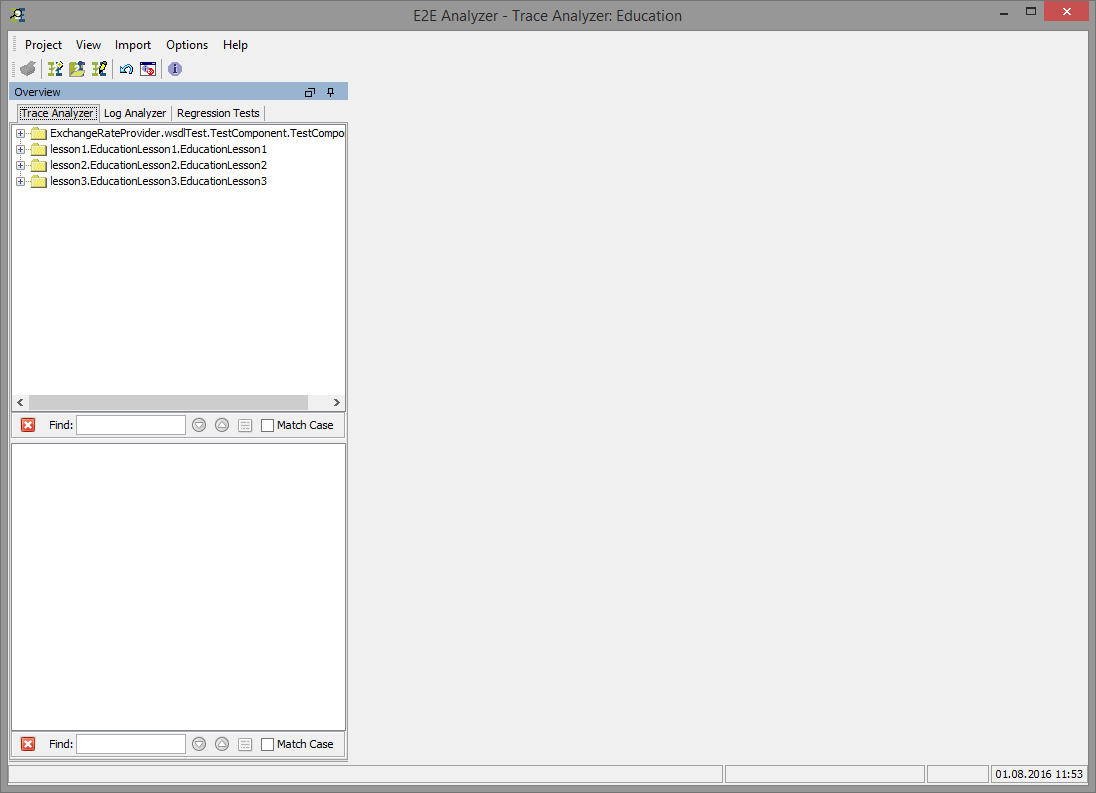
As you have used the Analyzer before with lesson2, E2E Builder Project Education reopens automatically:

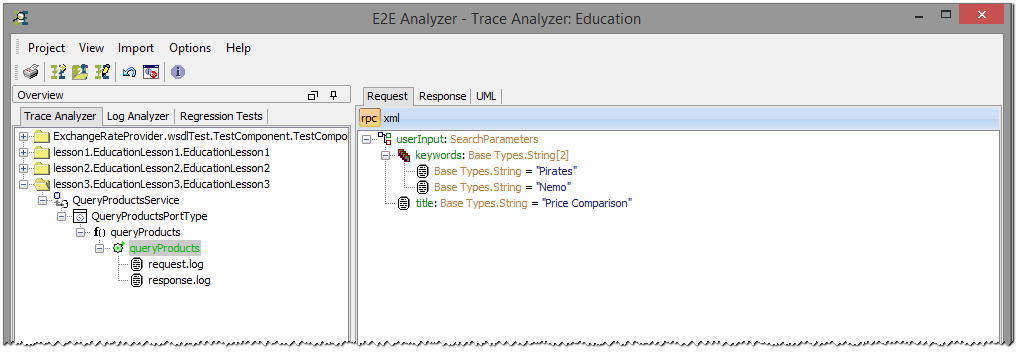
Expand the tree of the lesson3 service lesson3.EducationLesson3.EducationLesson3:

You can see the request and response log from the earlier running of the test case with the SOAP Test Tool.
